


 Syntax
| Visual Basic (Declaration) | |
|---|---|
Public Event MouseRightButtonDown As MouseButtonEventHandler | |
| C# | |
|---|---|
public event MouseButtonEventHandler MouseRightButtonDown | |
Remarks
The Graphic.MouseRightButtonDown is useful for capturing when the user has clicked with the Right Mouse Button in the bounding area of a Graphic. Some useful scenarios for taking advantage of the Graphic.MouseRightButtonDown Event include:
- Display information in another control about Attribute information for a Graphic (see the code example in this document)
- Start an animation on another control as a result of focus of a particular Graphic being received
There are two input parameters that are passed into the Graphic.MouseRightButtonDown Event when it is fired, they are: sender, and e.
sender is the Graphic for which the mouse, stylus, or touch has just been clicked on.
e is a System.Windows.Input.MouseButtonEventArgs and has three Properties: StylusDevice, OriginalSource, and Handled. One of most important Properties of StylusDevice is the DeviceType which will tell whether the pointer that has entered the Graphic is a mouse, stylus or touch. The OriginalSource Property gets a reference to the object that raised the event. The Handled Property gets or sets a value that marks the routed event as handled (a True value for Handled prevents most handlers along the event route from handling the same event again; the default value is False).
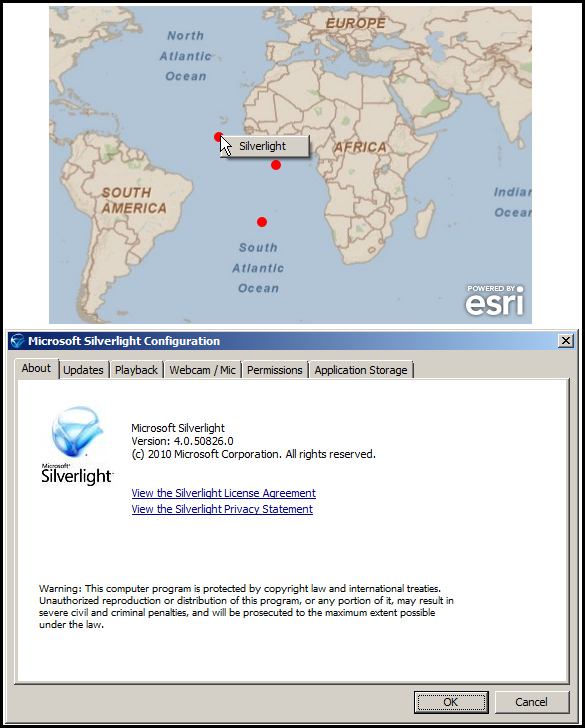
When working in a Silverlight application and trying to use Graphic.MouseRightButtonDown Event, setting the e.Handled Property to True becomes paramount in order to override the default functionality of the Microsoft Silverlight Configuration dialog automatically showing whenever the user right clicks in a Silverlight application. By setting e.Handled = True, the routed Event is considered handled and the Microsoft Silverlight Configuration dialog will not display and allows the remainder of the Graphic.MouseRightButtonDown Event to process. The following screen shot provides a visual example of right clicking over a Graphic in the ESRI Map Control when the e.Handled is False (the default) and thereby causing the Silverlight button to appear which controls opening the Microsoft Silverlight Configuration dialog.
In order to make use of the Graphic.MouseRightButtonUp Event it is required to make use of the e.Handled = True in the Graphic.MouseRightButtonDown Event. If the e.Handled Property is left its default value (False) in the Graphic.MouseRightButtonDown Event, then the Graphic.MouseRightButtonUp Event will never fire.
The Graphic.MouseRightButtonDown Event only fires when a user right clicks on a Graphic. If the user right clicks with the mouse in the Map Control in an area where a Graphic is not located then the Event will not fire. This also means that if the user right clicks in an area of the Map Control where no Graphic exists then the Silverlight button will display.
Event Data
The event handler receives an argument of type MouseButtonEventArgs containing data related to this event. The following MouseButtonEventArgs properties provide information specific to this event.
| Property | Description |
|---|---|
| ClickCount | |
| Handled | |
| OriginalSource (Inherited from System.Windows.RoutedEventArgs) | |
| StylusDevice (Inherited from System.Windows.Input.MouseEventArgs) |
Example
How to use:
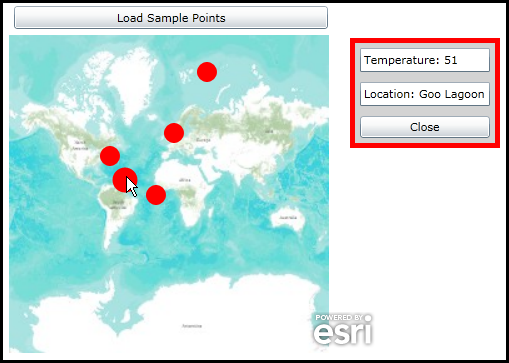
Click the button to add Graphics (with Attributes) to the Map. Then right-click on a graphic with the Mouse to launch a Popup that display Attribute information about the Graphic. Click the 'Close' button to close the Popup to get information on another Graphic.
The XAML code in this example is used in conjunction with the code-behind (C# or VB.NET) to demonstrate the functionality.
The following screen shot corresponds to the code example in this page.
| XAML |  Copy Code Copy Code |
|---|---|
<Grid x:Name="LayoutRoot"> <!-- Add a Map control with an ArcGISTiledMapServiceLayer --> <esri:Map Background="White" HorizontalAlignment="Left" Margin="0,150,0,0" Name="Map1" VerticalAlignment="Top" Height="318" Width="423" > <esri:ArcGISTiledMapServiceLayer ID="PhysicalTiledLayer" Url="http://services.arcgisonline.com/ArcGIS/rest/services/World_Topo_Map/MapServer" /> <!-- Create a GraphicsLayer to hold the Graphics that will be defined in code-behind. Setting the ID attribute is key to accessing in the code-behind. --> <esri:GraphicsLayer ID="MyGraphicsLayer" /> </esri:Map> <!-- Add a Button to perform the work. Note the Click Event handler is wired-up to use code-behind. --> <Button Content="Load Sample Points" Height="23" HorizontalAlignment="Left" Margin="57,121,0,0" Name="Button1" VerticalAlignment="Top" Width="314" Click="Button1_Click"/> <!-- Provide the instructions on how to use the sample code. --> <TextBlock Height="65" Name="TextBlock1" VerticalAlignment="Top" TextWrapping="Wrap" Margin="9,3,88,0" Text="Click the button to add Graphics (with Attributes) to the Map. Then right-click on a Graphic with the Mouse to launch a Popup that display Attribute information about the Graphic. Click the 'Close' button to close the Popup to get information on another Graphic." /> </Grid> | |
| C# | Copy Code |
|---|---|
private void Button1_Click(object sender, System.Windows.RoutedEventArgs e) { // This function adds a few MapPoint based Graphics with Attributes to the GraphicsLayer. // The GraphicsLayer was defined in XAML. ESRI.ArcGIS.Client.GraphicsLayer theGraphicsLayer = Map1.Layers["MyGraphicsLayer"]; ESRI.ArcGIS.Client.GraphicCollection theGraphicsCollection = theGraphicsLayer.Graphics; theGraphicsLayer.Graphics.Add(MakeMapPointGraphic2(-7356594.25, 4752385.95, 102100, 48, "Dead Man's Gulf")); theGraphicsLayer.Graphics.Add(MakeMapPointGraphic2(654893.89, 7718746.02, 102100, 50, "Shark Reef")); theGraphicsLayer.Graphics.Add(MakeMapPointGraphic2(4801033.36, 15325547.3, 102100, 52, "Crab Alley")); theGraphicsLayer.Graphics.Add(MakeMapPointGraphic2(-5468910.57, 1741081.03, 102100, 51, "Goo Lagoon")); theGraphicsLayer.Graphics.Add(MakeMapPointGraphic2(-1614958.43, -126382.05, 102100, 50, "Bikini Bottom")); } public object MakeMapPointGraphic2(double X, double Y, int SR, int anAttributeValue1, string anAttributeValue2) { // This function constructs a new Graphic using: // (1) coordinate pairs (X, Y) // (2) a SpatialReference.WKID (SR) // (3) some Attribute values (anAttributeValue, anAttributeValue2) // Create a SpatialReference for the Graphic. ESRI.ArcGIS.Client.Geometry.SpatialReference aSpatialReference = new ESRI.ArcGIS.Client.Geometry.SpatialReference(SR); // Create a MapPoint object and set its SpatialReference and coordinate (X,Y) information. ESRI.ArcGIS.Client.Geometry.MapPoint aMapPoint = new ESRI.ArcGIS.Client.Geometry.MapPoint(X, Y, aSpatialReference); // Create a new instance of one Graphic and assign its Geometry. ESRI.ArcGIS.Client.Graphic aGraphic = new ESRI.ArcGIS.Client.Graphic(); aGraphic.Geometry = (ESRI.ArcGIS.Client.Geometry.Geometry)aMapPoint; // Create a new instance of a SimpleMarkerSymbol and set its Color, Style, and Size Properties. ESRI.ArcGIS.Client.Symbols.SimpleMarkerSymbol aSimpleMarkerySymbol = new ESRI.ArcGIS.Client.Symbols.SimpleMarkerSymbol(); aSimpleMarkerySymbol.Color = new System.Windows.Media.SolidColorBrush(Colors.Red); aSimpleMarkerySymbol.Style = ESRI.ArcGIS.Client.Symbols.SimpleMarkerSymbol.SimpleMarkerStyle.Circle; aSimpleMarkerySymbol.Size = 20; aGraphic.Symbol = (ESRI.ArcGIS.Client.Symbols.Symbol)aSimpleMarkerySymbol; // Add some Attributes to the Graphic. aGraphic.Attributes.Add("Temperature", anAttributeValue1); aGraphic.Attributes.Add("Location", anAttributeValue2); // Dynamically wire-up the MouseRightButtonDown Event handler. aGraphic.MouseRightButtonDown += Graphic_MouseRightButtonDown; // Return the created Graphic. return aGraphic; } // Create a Popup to display Attribute information about a Graphic. In general using global variables (aka. // Member variables) is not a good coding practice but since we need to control Properties of the Popup // across multiple functions, its becomes a necessity. private Primitives.Popup _MyPopup = new Primitives.Popup(); private void Graphic_MouseRightButtonDown(object sender, System.Windows.Input.MouseButtonEventArgs e) { // This function overrides the default right mouse button click behavior to display a Microsoft // Popup control with some Graphic Attribute values when the user clicks on a Graphic. // NOTES: // e.StylusDevice is a System.Windows.Input.MouseEventArgs.StylusDevice Property // e.StylusDevice.DeviceType is a TabletDeviceType Enumeration value of (Mouse, Stylus, Touch) // e.OriginalSource is a System.Windows.Shapes.Ellipse // e.Handled is a Boolean denoting whether the routed event was handled // sender is the ESRI.ArcGIS.Client.Graphic that was clicked on // This is the way to stop the annoying Silverlight button from appearing! e.Handled = true; // Get the Graphic object that was clicked on. ESRI.ArcGIS.Client.Graphic theGraphic = (ESRI.ArcGIS.Client.Graphic)sender; // Create some content to show in the a Popup Control (_MpPopup). // Typically you would create a user control but we will create the UI element in code-behind // for an alternate approach. // Create a Border to hold all the other UI Elements. Border aBorder = new Border(); aBorder.BorderBrush = new SolidColorBrush(Colors.Red); aBorder.BorderThickness = new Thickness(5); // Add a Panel to the Border. StackPanel aStackPanel = new StackPanel(); aStackPanel.Background = new SolidColorBrush(Colors.LightGray); aBorder.Child = aStackPanel; // Add a TextBox to the StackPanel. Use a Graphic.Attribute to populate the TextBox.Text. TextBox aTextBox1 = new TextBox(); aTextBox1.Text = "Temperature: " + theGraphic.Attributes["Temperature"].ToString(); aTextBox1.Margin = new Thickness(5); aStackPanel.Children.Add(aTextBox1); // Add a TextBox to the StackPanel. Use a Graphic.Attribute to populate the TextBox.Text. TextBox aTextBox2 = new TextBox(); aTextBox2.Text = "Location: " + theGraphic.Attributes["Location"].ToString(); aTextBox2.Margin = new Thickness(5); aStackPanel.Children.Add(aTextBox2); // Add a Button to the StackPanel. Add an EventHandler for the Button to close the Popup. Button aButton = new Button(); aButton.Content = "Close"; aButton.Margin = new Thickness(5); aStackPanel.Children.Add(aButton); aButton.Click += button1A_Click; // Set the Child property of Popup to the Border (which contains the other nested UI elements). _MyPopup.Child = aBorder; // Set where the Popup will show up on the screen (just to the right of the Map). _MyPopup.VerticalOffset = 200; _MyPopup.HorizontalOffset = 400; // Open the Popup. It will stay in the screen until it is explicitly closed. _MyPopup.IsOpen = true; } private void button1A_Click(object sender, RoutedEventArgs e) { // Close the popup. _MyPopup.IsOpen = false; } | |
| VB.NET | Copy Code |
|---|---|
Private Sub Button1_Click(ByVal sender As System.Object, ByVal e As System.Windows.RoutedEventArgs) ' This function adds a few MapPoint based Graphics with Attributes to the GraphicsLayer. ' The GraphicsLayer was defined in XAML. Dim theGraphicsLayer As ESRI.ArcGIS.Client.GraphicsLayer = Map1.Layers("MyGraphicsLayer") Dim theGraphicsCollection As ESRI.ArcGIS.Client.GraphicCollection = theGraphicsLayer.Graphics theGraphicsLayer.Graphics.Add(MakeMapPointGraphic2(-7356594.25, 4752385.95, 102100, 48, "Dead Man's Gulf")) theGraphicsLayer.Graphics.Add(MakeMapPointGraphic2(654893.89, 7718746.02, 102100, 50, "Shark Reef")) theGraphicsLayer.Graphics.Add(MakeMapPointGraphic2(4801033.36, 15325547.3, 102100, 52, "Crab Alley")) theGraphicsLayer.Graphics.Add(MakeMapPointGraphic2(-5468910.57, 1741081.03, 102100, 51, "Goo Lagoon")) theGraphicsLayer.Graphics.Add(MakeMapPointGraphic2(-1614958.43, -126382.05, 102100, 50, "Bikini Bottom")) End Sub Public Function MakeMapPointGraphic2(ByVal X As Double, ByVal Y As Double, ByVal SR As Integer, ByVal anAttributeValue1 As Integer, ByVal anAttributeValue2 As String) ' This function constructs a new Graphic using: ' (1) coordinate pairs (X, Y) ' (2) a SpatialReference.WKID (SR) ' (3) some Attribute values (anAttributeValue, anAttributeValue2) ' Create a SpatialReference for the Graphic. Dim aSpatialReference As New ESRI.ArcGIS.Client.Geometry.SpatialReference(SR) ' Create a MapPoint object and set its SpatialReference and coordinate (X,Y) information. Dim aMapPoint As New ESRI.ArcGIS.Client.Geometry.MapPoint(X, Y, aSpatialReference) ' Create a new instance of one Graphic and assign its Geometry. Dim aGraphic As New ESRI.ArcGIS.Client.Graphic aGraphic.Geometry = CType(aMapPoint, ESRI.ArcGIS.Client.Geometry.Geometry) ' Create a new instance of a SimpleMarkerSymbol and set its Color, Style, and Size Properties. Dim aSimpleMarkerySymbol As New ESRI.ArcGIS.Client.Symbols.SimpleMarkerSymbol aSimpleMarkerySymbol.Color = New System.Windows.Media.SolidColorBrush(Colors.Red) aSimpleMarkerySymbol.Style = ESRI.ArcGIS.Client.Symbols.SimpleMarkerSymbol.SimpleMarkerStyle.Circle aSimpleMarkerySymbol.Size = 20 aGraphic.Symbol = CType(aSimpleMarkerySymbol, ESRI.ArcGIS.Client.Symbols.Symbol) ' Add some Attributes to the Graphic. aGraphic.Attributes.Add("Temperature", anAttributeValue1) aGraphic.Attributes.Add("Location", anAttributeValue2) ' Dynamically wire-up the MouseRightButtonDown Event handler. AddHandler aGraphic.MouseRightButtonDown, AddressOf Graphic_MouseRightButtonDown ' Return the created Graphic. Return aGraphic End Function ' Create a Popup to display Attribute information about a Graphic. In general using global variables (aka. ' Member variables) is not a good coding practice but since we need to control Properties of the Popup ' across multiple functions, its becomes a necessity. Private _MyPopup As Primitives.Popup = New Primitives.Popup() Private Sub Graphic_MouseRightButtonDown(ByVal sender As System.Object, ByVal e As System.Windows.Input.MouseButtonEventArgs) ' This function overrides the default right mouse button click behavior to display a Microsoft ' Popup control with some Graphic Attribute values when the user clicks on a Graphic. ' NOTES: ' e.StylusDevice is a System.Windows.Input.MouseEventArgs.StylusDevice Property ' e.StylusDevice.DeviceType is a TabletDeviceType Enumeration value of (Mouse, Stylus, Touch) ' e.OriginalSource is a System.Windows.Shapes.Ellipse ' e.Handled is a Boolean denoting whether the routed event was handled ' sender is the ESRI.ArcGIS.Client.Graphic that was clicked on ' This is the way to stop the annoying Silverlight button from appearing! e.Handled = True ' Get the Graphic object that was clicked on. Dim theGraphic As ESRI.ArcGIS.Client.Graphic = CType(sender, ESRI.ArcGIS.Client.Graphic) ' Create some content to show in the a Popup Control (_MpPopup). ' Typically you would create a user control but we will create the UI element in code-behind ' for an alternate approach. ' Create a Border to hold all the other UI Elements. Dim aBorder As New Border() aBorder.BorderBrush = New SolidColorBrush(Colors.Red) aBorder.BorderThickness = New Thickness(5) ' Add a Panel to the Border. Dim aStackPanel As New StackPanel() aStackPanel.Background = New SolidColorBrush(Colors.LightGray) aBorder.Child = aStackPanel ' Add a TextBox to the StackPanel. Use a Graphic.Attribute to populate the TextBox.Text. Dim aTextBox1 As New TextBox() aTextBox1.Text = "Temperature: " + theGraphic.Attributes.Item("Temperature").ToString aTextBox1.Margin = New Thickness(5) aStackPanel.Children.Add(aTextBox1) ' Add a TextBox to the StackPanel. Use a Graphic.Attribute to populate the TextBox.Text. Dim aTextBox2 As New TextBox() aTextBox2.Text = "Location: " + theGraphic.Attributes.Item("Location").ToString aTextBox2.Margin = New Thickness(5) aStackPanel.Children.Add(aTextBox2) ' Add a Button to the StackPanel. Add an EventHandler for the Button to close the Popup. Dim aButton As New Button() aButton.Content = "Close" aButton.Margin = New Thickness(5) aStackPanel.Children.Add(aButton) AddHandler aButton.Click, AddressOf button1A_Click ' Set the Child property of Popup to the Border (which contains the other nested UI elements). _MyPopup.Child = aBorder ' Set where the Popup will show up on the screen (just to the right of the Map). _MyPopup.VerticalOffset = 200 _MyPopup.HorizontalOffset = 400 ' Open the Popup. It will stay in the screen until it is explicitly closed. _MyPopup.IsOpen = True End Sub Private Sub button1A_Click(ByVal sender As Object, ByVal e As RoutedEventArgs) ' Close the popup. _MyPopup.IsOpen = False End Sub | |
Requirements
Target Platforms: Windows XP Professional, Windows Server 2003 family, Windows Vista, Windows Server 2008 family, Windows 7