


 Syntax
| Visual Basic (Declaration) | |
|---|---|
Public Event MouseEnter As MouseEventHandler | |
| C# | |
|---|---|
public event MouseEventHandler MouseEnter | |
Remarks
The Graphic.MouseEnter is useful for capturing when the user has moved the mouse, stylus, or touch into the bounding area of a Graphic. Some useful scenarios for taking advantage of the Graphic.MouseEnter Event include:
- Display information in another control about Attribute information for a Graphic (see the code example in this document)
- Start an animation on another control as a result of focus of a particular Graphic being received (see the code example document Graphic.MouseLeave)
- Take a particular action based upon a different StylusDevices being used
There are two input parameters that are passed into the Graphic.MouseEnter Event when it is fired, they are: sender and e.
sender is the Graphic for which the mouse, stylus, or touch has just entered its bounding area.
e is a System.Windows.Input.MouseEventArgs and has two Properties: StylusDevice and OriginalSource. One of most important Properties of StylusDevice is the DeviceType which will tell whether the pointer that has entered the Graphic is a mouse, stylus or touch. The OriginalSource Property gets a reference to the object that raised the event.
Modifying the symbology of a Graphic to give the appearance of a selection as a result of the Graphic.MouseEnter or Graphic.MouseLeave Events is in general not a good practice. The reason for this statement is that each time the symbology of a Graphic changes, it must be re-rendered which will re-invoke MouseEnter and MouseLeave Events and thereby cause a flickering effect. A better programming practice for giving the appearance of have a Graphic appear to be selected is to use the System.Windows.VisualStateManager. See the code examples of Graphic.Selected Property and Graphic.Select Method for examples of using the System.Windows.VisualStateManager.
Event Data
The event handler receives an argument of type MouseEventArgs containing data related to this event. The following MouseEventArgs properties provide information specific to this event.
| Property | Description |
|---|---|
| OriginalSource (Inherited from System.Windows.RoutedEventArgs) | |
| StylusDevice |
Example
How to use:
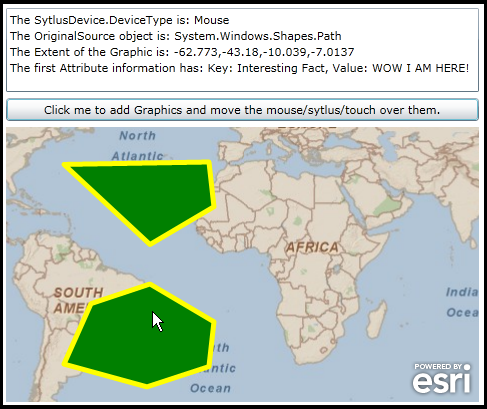
Click the button to add two Graphics on the Map. Move the mouse/stylus/touch pointing device over the Graphics to see Graphic.MouseEnter and Graphic.MouseLeave event handlers fire which provide information about each Graphic.
The following screen shot corresponds to the code example in this page.
| XAML |  Copy Code Copy Code |
|---|---|
<Grid x:Name="LayoutRoot"> <!-- Add a Map control with an ArcGISTiledMapServiceLayer --> <esri:Map Background="White" HorizontalAlignment="Left" Margin="12,193,0,0" Name="Map1" VerticalAlignment="Top" Height="275" Width="473" > <esri:ArcGISTiledMapServiceLayer ID="PhysicalTiledLayer" Url="http://services.arcgisonline.com/ArcGIS/rest/services/ESRI_StreetMap_World_2D/MapServer"/> </esri:Map> <!-- Add a Button to perform the work. Note the Click Event handler is wired-up to use code-behind. --> <Button Content="Click me to add Graphics and move the mouse/sytlus/touch over them." Height="23" HorizontalAlignment="Left" Margin="12,164,0,0" Name="Button1" VerticalAlignment="Top" Width="473" Click="Button1_Click"/> <!-- Add a TextBox to display information about a Graphic as the mouse/stylus/touch input devices moves across each it. --> <TextBox Height="84" HorizontalAlignment="Left" Margin="12,74,0,0" Name="TextBox1" VerticalAlignment="Top" Width="473" TextWrapping="Wrap" /> <!-- Provide the instructions on how to use the sample code. --> <TextBlock Height="65" Name="TextBlock1" VerticalAlignment="Top" TextWrapping="Wrap" Margin="9,3,186,0" Text="Click the button to add two Graphics on the Map. Move the mouse/stylus/touch pointing device over the Graphics to see Graphic.MouseEnter and Graphic.MouseLeave event handlers fire which provide information about each Graphic." /> </Grid> | |
| C# | Copy Code |
|---|---|
private void Button1_Click(object sender, System.Windows.RoutedEventArgs e) { // This is the driver function that will generate a two Polygon Graphics with an Attribute // and add them to the GraphicLayer of the Map Control. Each Graphic will also have a MouseEnter // and MouseLeave Event handler wired up for additional functionality. // Create a new instance of the GraphicsLayer object ESRI.ArcGIS.Client.GraphicsLayer myGraphicsLayer = new ESRI.ArcGIS.Client.GraphicsLayer(); // Add the first Polygon to the GraphicsLayer List<MyPoint> polygon1 = new List<MyPoint>(); polygon1.Add(new MyPoint(-10.039, -20.303)); polygon1.Add(new MyPoint(-32.539, -7.0137)); polygon1.Add(new MyPoint(-53.281, -13.923)); polygon1.Add(new MyPoint(-62.773, -35.174)); polygon1.Add(new MyPoint(-33.594, -43.18)); polygon1.Add(new MyPoint(-11.797, -36.032)); polygon1.Add(new MyPoint(-10.039, -20.303)); ESRI.ArcGIS.Client.Graphic aGraphic1 = MakePolygonGraphic(polygon1, 102100, "WOW I AM HERE!"); myGraphicsLayer.Graphics.Add(aGraphic1); // Add the second Polygon to the GraphicsLayer List<MyPoint> polygon2 = new List<MyPoint>(); polygon2.Add(new MyPoint(-10.039, 20.303)); polygon2.Add(new MyPoint(-32.539, 7.0137)); polygon2.Add(new MyPoint(-62.773, 35.174)); polygon2.Add(new MyPoint(-11.797, 36.032)); polygon2.Add(new MyPoint(-10.039, 20.303)); ESRI.ArcGIS.Client.Graphic aGraphic2 = MakePolygonGraphic(polygon2, 102100, "ITS A NICE DAY!"); myGraphicsLayer.Graphics.Add(aGraphic2); // Add the GraphicsLayer to the Layers collection of the Map (this will automatically cause a refresh of the Map). Map1.Layers.Add(myGraphicsLayer); } // A helper class used to construct MapPoints from coordinate pairs. public class MyPoint { //The coordinate pairs. public double X; public double Y; // The Constructor. public MyPoint(double inputX, double inputY) { X = inputX; Y = inputY; } } public ESRI.ArcGIS.Client.Graphic MakePolygonGraphic(List<MyPoint> inputPolygon, int inputSR, string anAttributeValue) { // A helper function that will generate a Polygon Graphic from a list of coordinate pairs, // an integer to define a SpatialRefernce, and an Attribute string that denotes some // characteristic of the Graphic. // Create a new instance of one Graphic. ESRI.ArcGIS.Client.Graphic aGraphic = new ESRI.ArcGIS.Client.Graphic(); // Make a new PointCollection to hold the vertices of the Polygon ESRI.ArcGIS.Client.Geometry.PointCollection aPointCollection = new ESRI.ArcGIS.Client.Geometry.PointCollection(); // Loop through all of the coordinate pairs (i.e. List(Of MyPoint) objects. foreach (MyPoint mp in inputPolygon) { // Create a SpatialReference for the Graphic. ESRI.ArcGIS.Client.Geometry.SpatialReference aSpatialReference = new ESRI.ArcGIS.Client.Geometry.SpatialReference(inputSR); // Create a MapPoint object and set its SpatialReference and coordinate (X,Y) information. ESRI.ArcGIS.Client.Geometry.MapPoint aMapPoint1 = new ESRI.ArcGIS.Client.Geometry.MapPoint(mp.X, mp.Y, aSpatialReference); // Add the MapPoint to the PointCollection which will be used to define the Polygon verticies. aPointCollection.Add(aMapPoint1); } // The PointCollection needs to be added to a new instance of an ObservableCollection. System.Collections.ObjectModel.ObservableCollection<ESRI.ArcGIS.Client.Geometry.PointCollection> anObservableCollection = new System.Collections.ObjectModel.ObservableCollection<ESRI.ArcGIS.Client.Geometry.PointCollection>(); anObservableCollection.Add(aPointCollection); // Create a new instance of a Polygon object and set the Rings and SpatialReference Properties. ESRI.ArcGIS.Client.Geometry.Polygon aPolygon = new ESRI.ArcGIS.Client.Geometry.Polygon(); aPolygon.Rings = anObservableCollection; aPolygon.SpatialReference = new ESRI.ArcGIS.Client.Geometry.SpatialReference(inputSR); // Create a new instance of a SimpleFillSymbol and set its Color, BorderBrush, and BorderThickness Properties. ESRI.ArcGIS.Client.Symbols.SimpleFillSymbol aSimpleFillSymbol = new ESRI.ArcGIS.Client.Symbols.SimpleFillSymbol(); aSimpleFillSymbol.Fill = new System.Windows.Media.SolidColorBrush(Colors.Green); aSimpleFillSymbol.BorderBrush = new System.Windows.Media.SolidColorBrush(Colors.Yellow); aSimpleFillSymbol.BorderThickness = 5; // Apply the Graphic's Geometry and Symbol Properties. aGraphic.Geometry = (ESRI.ArcGIS.Client.Geometry.Geometry)aPolygon; aGraphic.Symbol = (ESRI.ArcGIS.Client.Symbols.Symbol)aSimpleFillSymbol; // Add an Attribute to the Graphic. aGraphic.Attributes.Add("Interesting Fact", anAttributeValue); // Dynamically wire-up the MouseEnter and MouseLeave Event handlers. aGraphic.MouseEnter += Graphic_MouseEnter; aGraphic.MouseLeave += Graphic_MouseLeave; // Return the Graphic to the calling function. return aGraphic; } private void Graphic_MouseEnter(object sender, System.Windows.Input.MouseEventArgs e) { // This function will obtain the various input arguments for the Graphic.MouseEnter Event // and display the information in a TextBox. The information will be displayed when the // user moves the mouse/stylus/touch pointing device into a Graphic that has an MouseEnter // Event wired up. It can be highly useful for displaying Graphic.Attribute information in // other FrameworkElement UI Controls. // Obtain the various variable information from the input arguments. string theStylusDeviceType = e.StylusDevice.DeviceType.ToString(); string theOriginalSource = e.OriginalSource.GetType().ToString(); ESRI.ArcGIS.Client.Graphic theGraphic = (ESRI.ArcGIS.Client.Graphic)sender; string theGraphicExtent = sender.Geometry.Extent.ToString(); // Create a StringBuilder to hold the message we want to display. Text.StringBuilder myMessage = new Text.StringBuilder(); myMessage.Append("The SytlusDevice.DeviceType is: " + theStylusDeviceType + Environment.NewLine); myMessage.Append("The OriginalSource object is: " + theOriginalSource + Environment.NewLine); myMessage.Append("The Extent of the Graphic is: " + theGraphicExtent + Environment.NewLine); string theKey = theGraphic.Attributes.Keys[0].ToString(); myMessage.Append("The first Attribute information has: Key: " + theKey + ", Value: " + theGraphic.Attributes[theKey]); // Display the Message in a TextBox. TextBox1.Text = myMessage.ToString(); // NOTES: // e.StylusDevice is System.Windows.Input.MouseEventArgs.StylusDevice Property // e.StylusDevice.DeviceType = TabletDeviceType Enumeration value of (Mouse, Stylus, Touch) // e.OriginalSource is System.Windows.Shapes.Path // sender = the ESRI.ArcGIS.Client.Graphic } private void Graphic_MouseLeave(object sender, System.Windows.Input.MouseEventArgs e) { // Clear the TextBox since the mouse/stylus/touch pointing device is no longer over the Graphic. TextBox1.Text = ""; // NOTES: // e.StylusDevice is System.Windows.Input.MouseEventArgs.StylusDevice Property // e.StylusDevice.DeviceType = TabletDeviceType Enumeration value of (Mouse, Stylus, Touch) // e.OriginalSource is ESRI.ArcGIS.Client.Symbols.GraphicElement // sender = the ESRI.ArcGIS.Client.Graphic // Use these variables if you need to: // string theStylusDeviceType = e.StylusDevice.DeviceType.ToString(); // string theOriginalSource = e.OriginalSource.GetType().ToString(); // ESRI.ArcGIS.Client.Graphic theGraphic = (ESRI.ArcGIS.Client.Graphic)sender; // string theGraphicExtent = sender.Geometry.Extent.ToString(); } | |
| VB.NET | Copy Code |
|---|---|
Private Sub Button1_Click(ByVal sender As System.Object, ByVal e As System.Windows.RoutedEventArgs) ' This is the driver function that will generate a two Polygon Graphics with an Attribute ' and add them to the GraphicLayer of the Map Control. Each Graphic will also have a MouseEnter ' and MouseLeave Event handler wired up for additional functionality. ' Create a new instance of the GraphicsLayer object Dim myGraphicsLayer As New ESRI.ArcGIS.Client.GraphicsLayer ' Add the first Polygon to the GraphicsLayer Dim polygon1 As New List(Of MyPoint) polygon1.Add(New MyPoint(-10.039, -20.303)) polygon1.Add(New MyPoint(-32.539, -7.0137)) polygon1.Add(New MyPoint(-53.281, -13.923)) polygon1.Add(New MyPoint(-62.773, -35.174)) polygon1.Add(New MyPoint(-33.594, -43.18)) polygon1.Add(New MyPoint(-11.797, -36.032)) polygon1.Add(New MyPoint(-10.039, -20.303)) Dim aGraphic1 As ESRI.ArcGIS.Client.Graphic = MakePolygonGraphic(polygon1, 102100, "WOW I AM HERE!") myGraphicsLayer.Graphics.Add(aGraphic1) ' Add the second Polygon to the GraphicsLayer Dim polygon2 As New List(Of MyPoint) polygon2.Add(New MyPoint(-10.039, 20.303)) polygon2.Add(New MyPoint(-32.539, 7.0137)) polygon2.Add(New MyPoint(-62.773, 35.174)) polygon2.Add(New MyPoint(-11.797, 36.032)) polygon2.Add(New MyPoint(-10.039, 20.303)) Dim aGraphic2 As ESRI.ArcGIS.Client.Graphic = MakePolygonGraphic(polygon2, 102100, "ITS A NICE DAY!") myGraphicsLayer.Graphics.Add(aGraphic2) ' Add the GraphicsLayer to the Layers collection of the Map (this will automatically cause a refresh of the Map). Map1.Layers.Add(myGraphicsLayer) End Sub ' A helper class used to construct MapPoints from coordinate pairs. Public Class MyPoint 'The coordinate pairs. Public X As Double Public Y As Double ' The Constructor. Public Sub New(ByVal inputX As Double, ByVal inputY As Double) X = inputX Y = inputY End Sub End Class Public Function MakePolygonGraphic(ByVal inputPolygon As List(Of MyPoint), ByVal inputSR As Integer, ByVal anAttributeValue As String) As ESRI.ArcGIS.Client.Graphic ' A helper function that will generate a Polygon Graphic from a list of coordinate pairs, ' an integer to define a SpatialRefernce, and an Attribute string that denotes some ' characteristic of the Graphic. ' Create a new instance of one Graphic. Dim aGraphic As New ESRI.ArcGIS.Client.Graphic ' Make a new PointCollection to hold the vertices of the Polygon Dim aPointCollection As New ESRI.ArcGIS.Client.Geometry.PointCollection ' Loop through all of the coordinate pairs (i.e. List(Of MyPoint) objects. For Each mp As MyPoint In inputPolygon ' Create a SpatialReference for the Graphic. Dim aSpatialReference As New ESRI.ArcGIS.Client.Geometry.SpatialReference(inputSR) ' Create a MapPoint object and set its SpatialReference and coordinate (X,Y) information. Dim aMapPoint1 As New ESRI.ArcGIS.Client.Geometry.MapPoint(mp.X, mp.Y, aSpatialReference) ' Add the MapPoint to the PointCollection which will be used to define the Polygon verticies. aPointCollection.Add(aMapPoint1) Next ' The PointCollection needs to be added to a new instance of an ObservableCollection. Dim anObservableCollection As New System.Collections.ObjectModel.ObservableCollection(Of ESRI.ArcGIS.Client.Geometry.PointCollection) anObservableCollection.Add(aPointCollection) ' Create a new instance of a Polygon object and set the Rings and SpatialReference Properties. Dim aPolygon As New ESRI.ArcGIS.Client.Geometry.Polygon aPolygon.Rings = anObservableCollection aPolygon.SpatialReference = New ESRI.ArcGIS.Client.Geometry.SpatialReference(inputSR) ' Create a new instance of a SimpleFillSymbol and set its Color, BorderBrush, and BorderThickness Properties. Dim aSimpleFillSymbol As New ESRI.ArcGIS.Client.Symbols.SimpleFillSymbol aSimpleFillSymbol.Fill = New System.Windows.Media.SolidColorBrush(Colors.Green) aSimpleFillSymbol.BorderBrush = New System.Windows.Media.SolidColorBrush(Colors.Yellow) aSimpleFillSymbol.BorderThickness = 5 ' Apply the Graphic's Geometry and Symbol Properties. aGraphic.Geometry = CType(aPolygon, ESRI.ArcGIS.Client.Geometry.Geometry) aGraphic.Symbol = CType(aSimpleFillSymbol, ESRI.ArcGIS.Client.Symbols.Symbol) ' Add an Attribute to the Graphic. aGraphic.Attributes.Add("Interesting Fact", anAttributeValue) ' Dynamically wire-up the MouseEnter and MouseLeave Event handlers. AddHandler aGraphic.MouseEnter, AddressOf Graphic_MouseEnter AddHandler aGraphic.MouseLeave, AddressOf Graphic_MouseLeave ' Return the Graphic to the calling function. Return aGraphic End Function Private Sub Graphic_MouseEnter(ByVal sender As System.Object, ByVal e As System.Windows.Input.MouseEventArgs) ' This function will obtain the various input arguments for the Graphic.MouseEnter Event ' and display the information in a TextBox. The information will be displayed when the ' user moves the mouse/stylus/touch pointing device into a Graphic that has an MouseEnter ' Event wired up. It can be highly useful for displaying Graphic.Attribute information in ' other FrameworkElement UI Controls. ' Obtain the various variable information from the input arguments. Dim theStylusDeviceType As String = e.StylusDevice.DeviceType.ToString Dim theOriginalSource As String = e.OriginalSource.GetType.ToString Dim theGraphic As ESRI.ArcGIS.Client.Graphic = CType(sender, ESRI.ArcGIS.Client.Graphic) Dim theGraphicExtent As String = sender.Geometry.Extent.ToString ' Create a StringBuilder to hold the message we want to display. Dim myMessage As New Text.StringBuilder myMessage.Append("The SytlusDevice.DeviceType is: " + theStylusDeviceType + vbCrLf) myMessage.Append("The OriginalSource object is: " + theOriginalSource + vbCrLf) myMessage.Append("The Extent of the Graphic is: " + theGraphicExtent + vbCrLf) Dim theKey As String = theGraphic.Attributes.Keys(0).ToString myMessage.Append("The first Attribute information has: Key: " + theKey + ", Value: " + theGraphic.Attributes.Item(theKey)) ' Display the Message in a TextBox. TextBox1.Text = myMessage.ToString ' NOTES: ' e.StylusDevice is System.Windows.Input.MouseEventArgs.StylusDevice Property ' e.StylusDevice.DeviceType = TabletDeviceType Enumeration value of (Mouse, Stylus, Touch) ' e.OriginalSource is System.Windows.Shapes.Path ' sender = the ESRI.ArcGIS.Client.Graphic End Sub Private Sub Graphic_MouseLeave(ByVal sender As System.Object, ByVal e As System.Windows.Input.MouseEventArgs) ' Clear the TextBox since the mouse/stylus/touch pointing device is no longer over the Graphic. TextBox1.Text = "" ' NOTES: ' e.StylusDevice is System.Windows.Input.MouseEventArgs.StylusDevice Property ' e.StylusDevice.DeviceType = TabletDeviceType Enumeration value of (Mouse, Stylus, Touch) ' e.OriginalSource is ESRI.ArcGIS.Client.Symbols.GraphicElement ' sender = the ESRI.ArcGIS.Client.Graphic ' Use these variables if you need to: ' Dim theStylusDeviceType As String = e.StylusDevice.DeviceType.ToString ' Dim theOriginalSource As String = e.OriginalSource.GetType.ToString ' Dim theGraphic As ESRI.ArcGIS.Client.Graphic = CType(sender, ESRI.ArcGIS.Client.Graphic) ' Dim theGraphicExtent As String = sender.Geometry.Extent.ToString End Sub | |
Requirements
Target Platforms: Windows XP Professional, Windows Server 2003 family, Windows Vista, Windows Server 2008 family, Windows 7