


 Syntax
| Visual Basic (Declaration) | |
|---|---|
Public Function GetZIndex() As Integer | |
| C# | |
|---|---|
public int GetZIndex() | |
Remarks
A Z-Index is an internal property of a Graphic in a GraphicCollection that defines the stack order of the Graphic. A Graphic with a higher Z-Index value always draws on top of another Graphic with a lower Z-Index value.
By default all Graphic objects in a GraphicCollecton have a Z-Index value of zero (0) unless specifically set in either code-behind or XAML.
If no Z-Index value has ever been set, Graphics are drawn on the Map in the order that they are created in code-behind or XAML. This means the first Graphic in the GraphicCollection is drawn first and the process repeats itself until the last Graphic in the GraphicCollection is draw.
Do not confuse the Z-Index with another common GIS term: Z-Value. A Z-Value in an elevation or terrain model means elevation. In other kinds of surface models a Z-Value could represent density or quantify of a particular attribute.
Example
How to use:
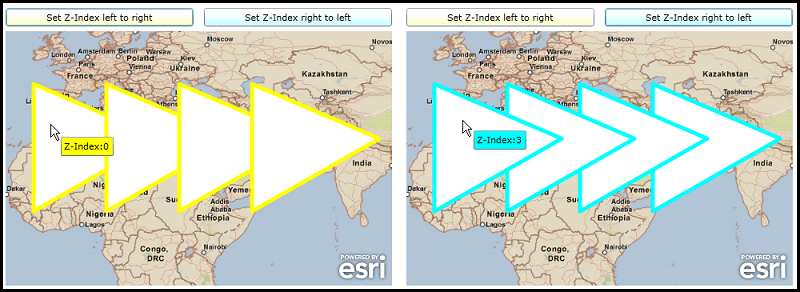
Click the two buttons to see how setting Z-Index values changes the Graphics visual appearance on the Map. Move the mouse cursor over some of the Graphics to display a MapTip showing Z-Index values.
The XAML code in this example is used in conjunction with the code-behind (C# or VB.NET) to demonstrate the functionality.
The following screen shot corresponds to the code example in this page.
| XAML |  Copy Code Copy Code |
|---|---|
<Grid x:Name="LayoutRoot"> <!-- Define some Resources that can be used in other parts of the XAML file. --> <Grid.Resources> <!-- Define a SimpleFillSymbol to use as the initial display of the Graphics on the Map. --> <esri:SimpleFillSymbol x:Key="HollowFillSymbol" BorderBrush="black" BorderThickness="2" /> <!-- Define a SpatialReference object that has the same WKID as the ArcGISTiledMapServiceLayer in the Map. This will allow for the Graphics in the GraphicsLayer to line up properly. --> <esri:SpatialReference x:Key="theSpatialReference" WKID="4326"/> </Grid.Resources> <!-- Add a Map control with an ArcGISTiledMapServiceLayer and a GraphicsLayer. The GraphicsLayer will contain several Graphics based upon Polygon geometries (which use the defined SpatialReference) and using the HollowFillSymbol as the default symbolization. --> <esri:Map Background="White" HorizontalAlignment="Left" Margin="12,111,0,0" Name="Map1" VerticalAlignment="Top" Height="318" Width="483" > <esri:ArcGISTiledMapServiceLayer ID="PhysicalTiledLayer" Url="http://services.arcgisonline.com/ArcGIS/rest/services/ESRI_StreetMap_World_2D/MapServer"/> <!-- It is important to provide the GraphicsLayer with an 'ID' Attribute so to be able to access it in the code-behind file. --> <esri:GraphicsLayer ID="MyGraphicsLayer" > <esri:GraphicsLayer.Graphics> <!-- Define several Polygon based Graphics using the StaticResources for the Symbol and SpatialReference. --> <esri:Graphic Symbol="{StaticResource HollowFillSymbol}"> <esri:Polygon SpatialReference="{StaticResource theSpatialReference}"> <esri:Polygon.Rings> <esri:PointCollection> <esri:MapPoint X="-10" Y="10" /> <esri:MapPoint X="-10" Y="45" /> <esri:MapPoint X="25" Y="30" /> <esri:MapPoint X="-10" Y="10" /> </esri:PointCollection> </esri:Polygon.Rings> </esri:Polygon> </esri:Graphic> <esri:Graphic Symbol="{StaticResource HollowFillSymbol}"> <esri:Polygon SpatialReference="{StaticResource theSpatialReference}"> <esri:Polygon.Rings> <esri:PointCollection> <esri:MapPoint X="10" Y="10" /> <esri:MapPoint X="10" Y="45" /> <esri:MapPoint X="45" Y="30" /> <esri:MapPoint X="10" Y="10" /> </esri:PointCollection> </esri:Polygon.Rings> </esri:Polygon> </esri:Graphic> <esri:Graphic Symbol="{StaticResource HollowFillSymbol}"> <esri:Polygon SpatialReference="{StaticResource theSpatialReference}"> <esri:Polygon.Rings> <esri:PointCollection> <esri:MapPoint X="30" Y="10" /> <esri:MapPoint X="30" Y="45" /> <esri:MapPoint X="65" Y="30" /> <esri:MapPoint X="30" Y="10" /> </esri:PointCollection> </esri:Polygon.Rings> </esri:Polygon> </esri:Graphic> <esri:Graphic Symbol="{StaticResource HollowFillSymbol}"> <esri:Polygon SpatialReference="{StaticResource theSpatialReference}"> <esri:Polygon.Rings> <esri:PointCollection> <esri:MapPoint X="50" Y="10" /> <esri:MapPoint X="50" Y="45" /> <esri:MapPoint X="85" Y="30" /> <esri:MapPoint X="50" Y="10" /> </esri:PointCollection> </esri:Polygon.Rings> </esri:Polygon> </esri:Graphic> </esri:GraphicsLayer.Graphics> </esri:GraphicsLayer> </esri:Map> <!-- Provide the instructions on how to use the sample code. --> <TextBlock Height="64" HorizontalAlignment="Left" Name="TextBlock1" VerticalAlignment="Top" Width="512" TextWrapping="Wrap" Margin="12,12,0,0" Text="Click the two buttons to see how setting Z-Index values changes the Graphics visual appearance on the Map. Move the mouse cursor over some of the Graphics to display a MapTip showing Z-Index values." /> <!-- Add two Buttons to perform the work. Note: the Click Event handlers are wired-up to use code-behind. --> <Button Content="Set Z-Index left to right" Height="23" HorizontalAlignment="Left" Margin="12,82,0,0" Name="Button1" VerticalAlignment="Top" Width="235" Click="Button1_Click"/> <Button Content="Set Z-Index right to left" Height="23" HorizontalAlignment="Left" Margin="260,82,0,0" Name="Button2" VerticalAlignment="Top" Width="235" Click="Button2_Click"/> </Grid> | |
| C# | Copy Code |
|---|---|
private void Button1_Click(object sender, System.Windows.RoutedEventArgs e) { // This function set the Z Index value in the same order as the Graphics in the GraphicsLayer. A MapTip // for the Graphic is set up to display the Z index value. The symbology is modified from the intial // setting in XAML. // Get the GraphcsLayer from what was defined in XAML. ESRI.ArcGIS.Client.GraphicsLayer theGraphicsLayer = (ESRI.ArcGIS.Client.GraphicsLayer) Map1.Layers["MyGraphicsLayer"]; // Get the GraphicCollection from the GraphicsLayer. ESRI.ArcGIS.Client.GraphicCollection theGraphicCollection = theGraphicsLayer.Graphics; // Create a counter. int myindex = 0; // Loop through each Graphic in the GraphicCollection foreach (ESRI.ArcGIS.Client.Graphic aGraphic in theGraphicCollection) { // Set the Z Index value by the counter. aGraphic.SetZIndex(myindex); // Incriment the counter. myindex = myindex + 1; // Create a new instance of a SimpleFillSymbol and set its Color, BorderBrush, and BorderThickness // Properties and apply it to the Graphic. ESRI.ArcGIS.Client.Symbols.SimpleFillSymbol aSimpleFillSymbol = new ESRI.ArcGIS.Client.Symbols.SimpleFillSymbol(); aSimpleFillSymbol.Fill = new System.Windows.Media.SolidColorBrush(Colors.Green); aSimpleFillSymbol.BorderBrush = new System.Windows.Media.SolidColorBrush(Colors.Yellow); aSimpleFillSymbol.BorderThickness = 5; aGraphic.Symbol = aSimpleFillSymbol; // Set up a simple MapTip for the Graphic to display the Z Index value. TextBox aTextBox1 = new TextBox(); aTextBox1.Text = "Z-Index:" + aGraphic.GetZIndex().ToString(); aTextBox1.Background = new System.Windows.Media.SolidColorBrush(Colors.Yellow); aGraphic.MapTip = aTextBox1; } } private void Button2_Click(object sender, System.Windows.RoutedEventArgs e) { // This function set the Z Index value in the reverse order as the Graphics in the GraphicsLayer. A MapTip // for the Graphic is set up to display the Z index value. The symbology is modified from the intial // setting in XAML. // Get the GraphcsLayer from what was defined in XAML. ESRI.ArcGIS.Client.GraphicsLayer theGraphicsLayer = (ESRI.ArcGIS.Client.GraphicsLayer) Map1.Layers["MyGraphicsLayer"]; // Get the GraphicCollection from the GraphicsLayer. ESRI.ArcGIS.Client.GraphicCollection theGraphicCollection = theGraphicsLayer.Graphics; // Create a counter. Set it to the count of all the Graphics in the GraphicsCollection - 1. int myindex = theGraphicCollection.Count - 1; // Loop through each Graphic in the GraphicCollection foreach (ESRI.ArcGIS.Client.Graphic aGraphic in theGraphicCollection) { // Set the Z Index value by the counter. aGraphic.SetZIndex(myindex); // Decriment the counter. myindex = myindex - 1; // Create a new instance of a SimpleFillSymbol and set its Color, BorderBrush, and BorderThickness // Properties and apply it to the Graphic. ESRI.ArcGIS.Client.Symbols.SimpleFillSymbol aSimpleFillSymbol = new ESRI.ArcGIS.Client.Symbols.SimpleFillSymbol(); aSimpleFillSymbol.Fill = new System.Windows.Media.SolidColorBrush(Colors.Red); aSimpleFillSymbol.BorderBrush = new System.Windows.Media.SolidColorBrush(Colors.Cyan); aSimpleFillSymbol.BorderThickness = 5; aGraphic.Symbol = aSimpleFillSymbol; // Set up a simple MapTip for the Graphic to display the Z Index value. TextBox aTextBox1 = new TextBox(); aTextBox1.Text = "Z-Index:" + aGraphic.GetZIndex().ToString(); aTextBox1.Background = new System.Windows.Media.SolidColorBrush(Colors.Cyan); aGraphic.MapTip = aTextBox1; } } | |
| VB.NET | Copy Code |
|---|---|
Private Sub Button1_Click(ByVal sender As System.Object, ByVal e As System.Windows.RoutedEventArgs) ' This function set the Z Index value in the same order as the Graphics in the GraphicsLayer. A MapTip ' for the Graphic is set up to display the Z index value. The symbology is modified from the intial ' setting in XAML. ' Get the GraphcsLayer from what was defined in XAML. Dim theGraphicsLayer As ESRI.ArcGIS.Client.GraphicsLayer = Map1.Layers("MyGraphicsLayer") ' Get the GraphicCollection from the GraphicsLayer. Dim theGraphicCollection As ESRI.ArcGIS.Client.GraphicCollection = theGraphicsLayer.Graphics ' Create a counter. Dim myindex As Integer = 0 ' Loop through each Graphic in the GraphicCollection For Each aGraphic As ESRI.ArcGIS.Client.Graphic In theGraphicCollection ' Set the Z Index value by the counter. aGraphic.SetZIndex(myindex) ' Incriment the counter. myindex = myindex + 1 ' Create a new instance of a SimpleFillSymbol and set its Color, BorderBrush, and BorderThickness ' Properties and apply it to the Graphic. Dim aSimpleFillSymbol As New ESRI.ArcGIS.Client.Symbols.SimpleFillSymbol aSimpleFillSymbol.Fill = New System.Windows.Media.SolidColorBrush(Colors.Green) aSimpleFillSymbol.BorderBrush = New System.Windows.Media.SolidColorBrush(Colors.Yellow) aSimpleFillSymbol.BorderThickness = 5 aGraphic.Symbol = aSimpleFillSymbol ' Set up a simple MapTip for the Graphic to display the Z Index value. Dim aTextBox1 As New TextBox aTextBox1.Text = "Z-Index:" + aGraphic.GetZIndex.ToString aTextBox1.Background = New System.Windows.Media.SolidColorBrush(Colors.Yellow) aGraphic.MapTip = aTextBox1 Next End Sub Private Sub Button2_Click(ByVal sender As System.Object, ByVal e As System.Windows.RoutedEventArgs) ' This function set the Z Index value in the reverse order as the Graphics in the GraphicsLayer. A MapTip ' for the Graphic is set up to display the Z index value. The symbology is modified from the intial ' setting in XAML. ' Get the GraphcsLayer from what was defined in XAML. Dim theGraphicsLayer As ESRI.ArcGIS.Client.GraphicsLayer = Map1.Layers("MyGraphicsLayer") ' Get the GraphicCollection from the GraphicsLayer. Dim theGraphicCollection As ESRI.ArcGIS.Client.GraphicCollection = theGraphicsLayer.Graphics ' Create a counter. Set it to the count of all the Graphics in the GraphicCollection - 1. Dim myindex As Integer = theGraphicCollection.Count - 1 ' Loop through each Graphic in the GraphicCollection For Each aGraphic As ESRI.ArcGIS.Client.Graphic In theGraphicCollection ' Set the Z Index value by the counter. aGraphic.SetZIndex(myindex) ' Decriment the counter. myindex = myindex - 1 ' Create a new instance of a SimpleFillSymbol and set its Color, BorderBrush, and BorderThickness ' Properties and apply it to the Graphic. Dim aSimpleFillSymbol As New ESRI.ArcGIS.Client.Symbols.SimpleFillSymbol aSimpleFillSymbol.Fill = New System.Windows.Media.SolidColorBrush(Colors.Red) aSimpleFillSymbol.BorderBrush = New System.Windows.Media.SolidColorBrush(Colors.Cyan) aSimpleFillSymbol.BorderThickness = 5 aGraphic.Symbol = aSimpleFillSymbol ' Set up a simple MapTip for the Graphic to display the Z Index value. Dim aTextBox1 As New TextBox aTextBox1.Text = "Z-Index:" + aGraphic.GetZIndex.ToString aTextBox1.Background = New System.Windows.Media.SolidColorBrush(Colors.Cyan) aGraphic.MapTip = aTextBox1 Next End Sub | |
Requirements
Target Platforms: Windows XP Professional, Windows Server 2003 family, Windows Vista, Windows Server 2008 family, Windows 7