


 Syntax
| Visual Basic (Declaration) | |
|---|---|
Public Shared Function Area( _ ByVal polygon As Polygon, _ Optional ByVal maxSegmentLength As Double _ ) As Double | |
| C# | |
|---|---|
public static double Area( Polygon polygon, double maxSegmentLength ) | |
Remarks
The term Geodesic means calculating the shortest distance between two points on a sphere. Using Geodesic algorithms to calculate distances provides a highly accurate way to obtain length and area of measurements of geographic features. The Geodesic algorithm uses the concept of a great circle to obtain the shortest route between two points along the Earth’s surface. The length and area measurements obtained via the Geodesic functions are superior to those of the Euclidian functions, as the Euclidian functions are based upon a projection (i.e. a flat 2D representation of a 3D surface) which introduces distortion.
The Geodesic.Area is a Shared/Static function which means that you do not use the new keyword to instantiate it. The input optional parameter maxSegmentLength for the Geodesic.Area Method is the maximum length of segments in meters when performing the area calculation; the default value is 10000 meters.
The Polyline and Polygon Geometries that are used as parameters in the Geodesic functions require that the SpatialReference be in Geographic Coordinate System based upon latitude and longitude coordinates. The SpatialReference is a combination of an ellipsoid, datum, and a coordinate system used to display geographic data of the three dimensional Earth on a two dimensional surface (such as a piece of paper of computer monitor). A good article for describing how a spatial reference works can be found here. If the SpatialReference of the geometries in the layer are in a Projected Coordinate System then it will be required to converted those geometries into a Geographic Coordinate System via Methods like: Projection.WebMercator.ToGeographic or Tasks.GeometryService.ProjectAsync(IEnumerable<Graphic>,SpatialReference).
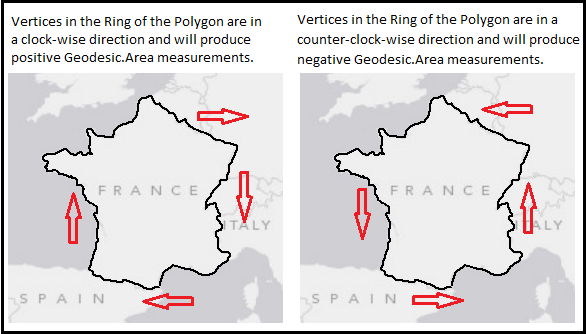
When using the Geodesic. Area Method, in order to obtain positive area values, the vertices that make up the Rings of the Polygon need to be oriented in a clock-wise fashion. If the vertices that make up the Rings of the Polygon are in a counter-clock-wise fashion the Geodesic.Area that is calculated will be negative. Use GeometryService.SimplifyAsync(IList<Graphic>) to correct orientation of vertices to ensure positive Geodesic.Area calculations. See the following visual depiction:
Parameters
- polygon
- The polygon to calculate area for.
- maxSegmentLength
- Maximum length of the segments in meters when performing the area calculation (default: 10000 meters).
Return Value
Area in square-meters.Example
How to use:
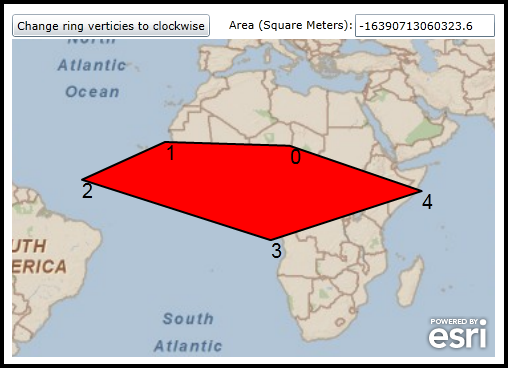
Click the button to change the orientation of the vertices in the Ring of the Polygon from counter-clock-wise to clock-wise. Then the Geodesic.Area calculation will return a positive number.
The XAML code in this example is used in conjunction with the code-behind (C# or VB.NET) to demonstrate the functionality.
The following screen shot corresponds to the code example in this page.
| XAML |  Copy Code Copy Code |
|---|---|
<Grid x:Name="LayoutRoot"> <!-- Define some Resources that can be used in other parts of the XAML file. --> <Grid.Resources> <!-- Define a SimpleFillSymbol to use as the initial display of the Polygon Graphic on the Map. --> <esri:SimpleFillSymbol x:Key="RedFillSymbol" BorderBrush="Black" BorderThickness="2" Fill="Red"/> <!-- Define a SimpleFillSymbol to use as the display of the Polygon Graphic on the Map after the user clicks the Button. --> <esri:SimpleFillSymbol x:Key="GreenFillSymbol" BorderBrush="Black" BorderThickness="2" Fill="Green"/> <!-- Define a SpatialReference object that has the same WKID as the ArcGISTiledMapServiceLayer in the Map. This will allow for the Graphics in the GraphicsLayer to line up properly. --> <esri:SpatialReference x:Key="theSpatialReference" WKID="4326"/> </Grid.Resources> <!-- Add a Map control with an ArcGISTiledMapServiceLayer. --> <esri:Map Background="White" HorizontalAlignment="Left" Margin="12,107,0,0" Name="Map1" VerticalAlignment="Top" Height="318" Width="483" WrapAround="True" Extent="-58.53,-38.95,69.42,45.28"> <!-- Add a backdrop ArcGISTiledMapServiceLayer. The SpatialReference = 4326 (Geographic Coordinate System). --> <esri:ArcGISTiledMapServiceLayer ID="PhysicalTiledLayer" Url="http://services.arcgisonline.com/ArcGIS/rest/services/ESRI_StreetMap_World_2D/MapServer"/> <!-- Add a GraphicsLayer with a single Polygon. It is important to provide the GraphicsLayer with an 'ID' Attribute so to be able to access it in the code-behind file. --> <esri:GraphicsLayer ID="MyGraphicsLayer" Initialized="GraphicsLayer_Initialized"> <!--Add the Graphics to the GraphicsLayer. --> <esri:GraphicsLayer.Graphics> <!-- Define a Polygon using the StaticResources for the Symbol and SpatialReference. The Geometry.Geodesic Shared/static Methods that will be used when clicking the Button should work on Graphic features based upon the Geographic Coordinate System (using Latitude/Longitude units). --> <esri:Graphic Symbol="{StaticResource RedFillSymbol}"> <esri:Polygon SpatialReference="{StaticResource theSpatialReference}"> <esri:Polygon.Rings> <esri:PointCollection> <esri:MapPoint X="15" Y="17" /> <esri:MapPoint X="-18" Y="18" /> <esri:MapPoint X="-40" Y="8" /> <esri:MapPoint X="10" Y="-8" /> <esri:MapPoint X="50" Y="5" /> <esri:MapPoint X="15" Y="17" /> </esri:PointCollection> </esri:Polygon.Rings> </esri:Polygon> </esri:Graphic> </esri:GraphicsLayer.Graphics> </esri:GraphicsLayer> </esri:Map> <!--Perform Geodesic.Areas calculations on the Polygon Graphic after it's Ring orientation has been corrected. --> <sdk:Label Height="17" HorizontalAlignment="Left" Margin="229,85,0,0" Name="Label_Areas" VerticalAlignment="Top" Width="131" Content="Area (Square Meters): "/> <TextBox Height="23" HorizontalAlignment="Left" Margin="355,82,0,0" Name="TextBox_Areas" VerticalAlignment="Top" Width="140" /> <Button Content="Change ring verticies to clockwise" Height="23" HorizontalAlignment="Left" Margin="12,82,0,0" Name="Button1" VerticalAlignment="Top" Width="198" Click="Button1_Click"/> <!-- Provide the instructions on how to use the sample code. --> <TextBlock Height="57" HorizontalAlignment="Left" Name="TextBlock1" VerticalAlignment="Top" Width="493" TextWrapping="Wrap" Margin="2,9,0,0" Text="Click the button to change the orientation of the vertices in the Ring of the Polygon from counter-clock-wise to clock-wise. Then the Geodesic.Area calculation will return a positive number." /> </Grid> | |
| C# | Copy Code |
|---|---|
private void GraphicsLayer_Initialized(object sender, System.EventArgs e) { // Once the GraphcsLayer has initialized call two different functions. One to perform the Geodesic.Area calculation // (via the DisplayArea function). The second to display the vertices of the Rings of the Polygon Graphic with a // TextSymbol so users can see the orientation of how the Polygon was constructed (via the // DisplayPolygonVerticiesAsTextSymbol function). DisplayArea(); DisplayPolygonVerticesAsTextSymbol(); } public void DisplayArea() { // Get the GraphicsLayer that was defined in XAML. It contain a single Polygon Graphic. ESRI.ArcGIS.Client.GraphicsLayer theGraphicsLayer = (ESRI.ArcGIS.Client.GraphicsLayer)(Map1.Layers["MyGraphicsLayer"]); // Loop through the Graphics in the GraphicsLayer (there should only be one Polygon graphic). foreach (ESRI.ArcGIS.Client.Graphic theGraphic in theGraphicsLayer) { // Get the Geometry of the Graphic. ESRI.ArcGIS.Client.Geometry.Geometry theGeometry = theGraphic.Geometry; // Define a variable to hold the Geodesic.Area calculation. double theArea = 0; // Only process Polygon Graphics. if ((theGeometry) is ESRI.ArcGIS.Client.Geometry.Polygon) { // Cast the generic Geometry of the Graphic to a Polygon. ESRI.ArcGIS.Client.Geometry.Polygon thePolygon = (ESRI.ArcGIS.Client.Geometry.Polygon)theGeometry; // Calculate the Geodesic.Area of the Polygon. theArea = ESRI.ArcGIS.Client.Geometry.Geodesic.Area(thePolygon, 100); } // Display the Geodesic.Area to the user. TextBox_Areas.Text = theArea.ToString(); } } private void Button1_Click(object sender, System.Windows.RoutedEventArgs e) { // Define a new GeometryService that will re-orient the Rings of the Polygon Graphic to be clock-wise. ESRI.ArcGIS.Client.Tasks.GeometryService geometryService = new ESRI.ArcGIS.Client.Tasks.GeometryService("http://tasks.arcgisonline.com/ArcGIS/rest/services/Geometry/GeometryServer"); // Add an EventHandler to process when the GeometryService is complete. geometryService.SimplifyCompleted += GeometryService_SimplifyCompleted; // Add an EvenHandler in case there is a problem with the GeometryService. geometryService.Failed += GeometryService_Failed; // Get the GraphicsLayer that was created in XAML with the Polygon Graphic. ESRI.ArcGIS.Client.GraphicsLayer theGraphicsLayer = (ESRI.ArcGIS.Client.GraphicsLayer)(Map1.Layers["MyGraphicsLayer"]); // Create a new List<Graphic> object. This is needed as an input for the GeometryService.SimplifyAsync Method. List<ESRI.ArcGIS.Client.Graphic> graphicList = new List<ESRI.ArcGIS.Client.Graphic>(); // Loop through each Graphic in the GraphicsLayer. foreach (ESRI.ArcGIS.Client.Graphic theGraphic in theGraphicsLayer) { // If we have a Polygon Graphic do more processing. if ((theGraphic.Geometry) is ESRI.ArcGIS.Client.Geometry.Polygon) { // Add the Polygon Graphic into the GraphicList. graphicList.Add(theGraphic); } } // Call the Asynchronous GeometryService.SimplifyAsync Method. geometryService.SimplifyAsync(graphicList); } private void GeometryService_SimplifyCompleted(object sender, ESRI.ArcGIS.Client.Tasks.GraphicsEventArgs args) { // The GeometryService.SimplifyAsync Method has completed! // Get the GraphicsLayer defined in XAML. At this point there will be several Graphics because some additonal // MapPoint's were added using TextSymbols to show the order of vertices used to make up the Rings of the // Polygon Graphic. ESRI.ArcGIS.Client.GraphicsLayer theGraphicsLayer = (ESRI.ArcGIS.Client.GraphicsLayer)(Map1.Layers["MyGraphicsLayer"]); // Clear out all the Graphics in the GraphicsLayer. theGraphicsLayer.ClearGraphics(); // Create a new Graphic that will hold the new Polygon with the Ring using the correct (i.e. clock-wise) vertex // orientation which will give a positive Geodesic.Area calculation. ESRI.ArcGIS.Client.Graphic aGraphic = new ESRI.ArcGIS.Client.Graphic(); // Get the new Polygon Graphic's Geometry from the return result of the GeometryService.SimplifyAsync Method. aGraphic.Geometry = args.Results[0].Geometry; // Set the Symbol of the new Polygon Graphic using one defined in XAML. aGraphic.Symbol = LayoutRoot.Resources["GreenFillSymbol"] as ESRI.ArcGIS.Client.Symbols.Symbol; // Add the new Polygon Graphic to the GraphicsLayer. theGraphicsLayer.Graphics.Add(aGraphic); // Call the same functions to re-render the map that was used when the application initially started. One to perform // the Geodesic.Area calculation (via the DisplayArea function). The second to display the vertices of the Rings of // the Polygon Graphic with a TextSymbol so users can see the orientation of how the Polygon was constructed (via the // DisplayPolygonVerticiesAsTextSymbol function). DisplayArea(); DisplayPolygonVerticesAsTextSymbol(); } private void GeometryService_Failed(object sender, ESRI.ArcGIS.Client.Tasks.TaskFailedEventArgs e) { // We have a problem with the GeometryService.SimplifyAsync Method. Display the issue to the user. MessageBox.Show("Geometry Service error: " + e.Error.Message); } public void DisplayPolygonVerticesAsTextSymbol() { // This function will show the order of the vertices for the Rings of the Polygon Graphic. This will help the // user see visually whether the Rings are clock-wise (which yield a positive Geodesic.Area calculation) or // counter-clock-wise (which yield a negative Geodesic.Area calculation). // Get the GraphicsLayer that was defined in XAML. ESRI.ArcGIS.Client.GraphicsLayer theGraphicsLayer = (ESRI.ArcGIS.Client.GraphicsLayer)(Map1.Layers["MyGraphicsLayer"]); // Create a temporary Polygon that will be used to obtain the vertices in the Rings. ESRI.ArcGIS.Client.Geometry.Polygon theTemporaryPolygon = null; // Loop through all of the Graphics in the GraphicsLayer (we should just have one Polygon Graphic at this point). foreach (ESRI.ArcGIS.Client.Graphic theGraphic in theGraphicsLayer) { // Get the Geometry of the Graphic. ESRI.ArcGIS.Client.Geometry.Geometry theGeometry = theGraphic.Geometry; // Only process Polygon Graphics. if ((theGeometry) is ESRI.ArcGIS.Client.Geometry.Polygon) { // Set the temporay Polygon to be the Geometry of the Polygon in the GraphicsLayer. theTemporaryPolygon = (ESRI.ArcGIS.Client.Geometry.Polygon)theGeometry; } } // Get the ObservableCollection<PointCollecton> from the temporary Polygon. This has the Ring of vertices. System.Collections.ObjectModel.ObservableCollection<ESRI.ArcGIS.Client.Geometry.PointCollection> theObservableCollectionOfPointCollection = theTemporaryPolygon.Rings; // Loop through each PointCollection in the ObservableCollection<PointCollecton>. foreach (ESRI.ArcGIS.Client.Geometry.PointCollection myPointCollection in theObservableCollectionOfPointCollection) { // Loop through all of the vertices in the Ring that defines the Polygon. Note: Don't process the last // vertex (i.e. myPointCollection.Count - 1) since the first and last vertex are the same in the Ring. for (int x = 0; x <= myPointCollection.Count - 2; x++) { // Create a new TextSymbol and define its look. The strings used to define the FontFamily can be // found in the following MSDN documentation: // http://msdn.microsoft.com/en-us/library/cc189010(v=VS.95).aspx ESRI.ArcGIS.Client.Symbols.TextSymbol aTextSymbol = new ESRI.ArcGIS.Client.Symbols.TextSymbol(); aTextSymbol.FontFamily = new FontFamily("Arial"); aTextSymbol.FontSize = 20; aTextSymbol.Foreground = new System.Windows.Media.SolidColorBrush(Colors.Black); // Set the TextSymbol.Text Property to the index order of the vertices in the Ring. aTextSymbol.Text = x.ToString(); // Assign the TextSymbol as the Graphic.Symbol as this was not previously done. ESRI.ArcGIS.Client.Graphic myVertexGraphic = new ESRI.ArcGIS.Client.Graphic(); myVertexGraphic.Geometry = myPointCollection[x]; myVertexGraphic.Symbol = (ESRI.ArcGIS.Client.Symbols.Symbol)aTextSymbol; // Add the MapPoints that display the vertex order to the GraphicsLayer. theGraphicsLayer.Graphics.Add(myVertexGraphic); } } } | |
| VB.NET | Copy Code |
|---|---|
Private Sub GraphicsLayer_Initialized(sender As System.Object, e As System.EventArgs) ' Once the GraphcsLayer has initialized call two different functions. One to perform the Geodesic.Area calculation ' (via the DisplayArea function). The second to display the vertices of the Rings of the Polygon Graphic with a ' TextSymbol so users can see the orientation of how the Polygon was constructed (via the ' DisplayPolygonVerticiesAsTextSymbol function). DisplayArea() DisplayPolygonVerticesAsTextSymbol() End Sub Public Sub DisplayArea() ' Get the GraphicsLayer that was defined in XAML. It contain a single Polygon Graphic. Dim theGraphicsLayer As ESRI.ArcGIS.Client.GraphicsLayer = CType(Map1.Layers("MyGraphicsLayer"), ESRI.ArcGIS.Client.GraphicsLayer) ' Loop through the Graphics in the GraphicsLayer (there should only be one Polygon graphic). For Each theGraphic As ESRI.ArcGIS.Client.Graphic In theGraphicsLayer ' Get the Geometry of the Graphic. Dim theGeometry As ESRI.ArcGIS.Client.Geometry.Geometry = theGraphic.Geometry ' Define a variable to hold the Geodesic.Area calculation. Dim theArea As Double = Nothing ' Only process Polygon Graphics. If TypeOf (theGeometry) Is ESRI.ArcGIS.Client.Geometry.Polygon Then ' Cast the generic Geometry of the Graphic to a Polygon. Dim thePolygon As ESRI.ArcGIS.Client.Geometry.Polygon = CType(theGeometry, ESRI.ArcGIS.Client.Geometry.Polygon) ' Calculate the Geodesic.Area of the Polygon. theArea = ESRI.ArcGIS.Client.Geometry.Geodesic.Area(thePolygon, 100) End If ' Display the Geodesic.Area to the user. TextBox_Areas.Text = theArea.ToString Next End Sub Private Sub Button1_Click(sender As System.Object, e As System.Windows.RoutedEventArgs) ' Define a new GeometryService that will re-orient the Rings of the Polygon Graphic to be clock-wise. Dim geometryService As New ESRI.ArcGIS.Client.Tasks.GeometryService("http://tasks.arcgisonline.com/ArcGIS/rest/services/Geometry/GeometryServer") ' Add an EventHandler to process when the GeometryService is complete. AddHandler geometryService.SimplifyCompleted, AddressOf GeometryService_SimplifyCompleted ' Add an EvenHandler in case there is a problem with the GeometryService. AddHandler geometryService.Failed, AddressOf GeometryService_Failed ' Get the GraphicsLayer that was created in XAML with the Polygon Graphic. Dim theGraphicsLayer As ESRI.ArcGIS.Client.GraphicsLayer = CType(Map1.Layers("MyGraphicsLayer"), ESRI.ArcGIS.Client.GraphicsLayer) ' Create a new List(Of Graphic) object. This is needed as an input for the GeometryService.SimplifyAsync Method. Dim graphicList As New List(Of ESRI.ArcGIS.Client.Graphic)() ' Loop through each Graphic in the GraphicsLayer. For Each theGraphic As ESRI.ArcGIS.Client.Graphic In theGraphicsLayer ' If we have a Polygon Graphic do more processing. If TypeOf (theGraphic.Geometry) Is ESRI.ArcGIS.Client.Geometry.Polygon Then ' Add the Polygon Graphic into the GraphicList. graphicList.Add(theGraphic) End If Next ' Call the Asynchronous GeometryService.SimplifyAsync Method. geometryService.SimplifyAsync(graphicList) End Sub Private Sub GeometryService_SimplifyCompleted(ByVal sender As Object, ByVal args As ESRI.ArcGIS.Client.Tasks.GraphicsEventArgs) ' The GeometryService.SimplifyAsync Method has completed! ' Get the GraphicsLayer defined in XAML. At this point there will be several Graphics because some additonal ' MapPoint's were added using TextSymbols to show the order of vertices used to make up the Rings of the ' Polygon Graphic. Dim theGraphicsLayer As ESRI.ArcGIS.Client.GraphicsLayer = CType(Map1.Layers("MyGraphicsLayer"), ESRI.ArcGIS.Client.GraphicsLayer) ' Clear out all the Graphics in the GraphicsLayer. theGraphicsLayer.ClearGraphics() ' Create a new Graphic that will hold the new Polygon with the Ring using the correct (i.e. clock-wise) vertex ' orientation which will give a positive Geodesic.Area calculation. Dim aGraphic As New ESRI.ArcGIS.Client.Graphic ' Get the new Polygon Graphic's Geometry from the return result of the GeometryService.SimplifyAsync Method. aGraphic.Geometry = args.Results(0).Geometry ' Set the Symbol of the new Polygon Graphic using one defined in XAML. aGraphic.Symbol = TryCast(LayoutRoot.Resources("GreenFillSymbol"), ESRI.ArcGIS.Client.Symbols.Symbol) ' Add the new Polygon Graphic to the GraphicsLayer. theGraphicsLayer.Graphics.Add(aGraphic) ' Call the same functions to re-render the map that was used when the application initially started. One to perform ' the Geodesic.Area calculation (via the DisplayArea function). The second to display the vertices of the Rings of ' the Polygon Graphic with a TextSymbol so users can see the orientation of how the Polygon was constructed (via the ' DisplayPolygonVerticiesAsTextSymbol function). DisplayArea() DisplayPolygonVerticesAsTextSymbol() End Sub Private Sub GeometryService_Failed(ByVal sender As Object, ByVal e As ESRI.ArcGIS.Client.Tasks.TaskFailedEventArgs) ' We have a problem with the GeometryService.SimplifyAsync Method. Display the issue to the user. MessageBox.Show("Geometry Service error: " + e.Error.Message) End Sub Public Sub DisplayPolygonVerticesAsTextSymbol() ' This function will show the order of the vertices for the Rings of the Polygon Graphic. This will help the ' user see visually whether the Rings are clock-wise (which yield a positive Geodesic.Area calculation) or ' counter-clock-wise (which yield a negative Geodesic.Area calculation). ' Get the GraphicsLayer that was defined in XAML. Dim theGraphicsLayer As ESRI.ArcGIS.Client.GraphicsLayer = CType(Map1.Layers("MyGraphicsLayer"), ESRI.ArcGIS.Client.GraphicsLayer) ' Create a temporary Polygon that will be used to obtain the vertices in the Rings. Dim theTemporaryPolygon As ESRI.ArcGIS.Client.Geometry.Polygon = Nothing ' Loop through all of the Graphics in the GraphicsLayer (we should just have one Polygon Graphic at this point). For Each theGraphic As ESRI.ArcGIS.Client.Graphic In theGraphicsLayer ' Get the Geometry of the Graphic. Dim theGeometry As ESRI.ArcGIS.Client.Geometry.Geometry = theGraphic.Geometry ' Only process Polygon Graphics. If TypeOf (theGeometry) Is ESRI.ArcGIS.Client.Geometry.Polygon Then ' Set the temporay Polygon to be the Geometry of the Polygon in the GraphicsLayer. theTemporaryPolygon = CType(theGeometry, ESRI.ArcGIS.Client.Geometry.Polygon) End If Next ' Get the ObservableCollection(OfPointCollecton) from the temporary Polygon. This has the Ring of vertices. Dim theObservableCollectionOfPointCollection As Collections.ObjectModel.ObservableCollection(Of ESRI.ArcGIS.Client.Geometry.PointCollection) = theTemporaryPolygon.Rings ' Loop through each PointCollection in the ObservableCollection(OfPointCollecton). For Each myPointCollection As ESRI.ArcGIS.Client.Geometry.PointCollection In theObservableCollectionOfPointCollection ' Loop through all of the vertices in the Ring that defines the Polygon. Note: Don't process the last ' vertex (i.e. myPointCollection.Count - 1) since the first and last vertex are the same in the Ring. For x As Integer = 0 To myPointCollection.Count - 2 ' Create a new TextSymbol and define its look. The strings used to define the FontFamily can be ' found in the following MSDN documentation: ' http://msdn.microsoft.com/en-us/library/cc189010(v=VS.95).aspx Dim aTextSymbol As New ESRI.ArcGIS.Client.Symbols.TextSymbol aTextSymbol.FontFamily = New FontFamily("Arial") aTextSymbol.FontSize = 20 aTextSymbol.Foreground = New System.Windows.Media.SolidColorBrush(Colors.Black) ' Set the TextSymbol.Text Property to the index order of the vertices in the Ring. aTextSymbol.Text = x.ToString ' Assign the TextSymbol as the Graphic.Symbol as this was not previously done. Dim myVertexGraphic As New ESRI.ArcGIS.Client.Graphic myVertexGraphic.Geometry = myPointCollection.Item(x) myVertexGraphic.Symbol = CType(aTextSymbol, ESRI.ArcGIS.Client.Symbols.Symbol) ' Add the MapPoints that display the vertex order to the GraphicsLayer. theGraphicsLayer.Graphics.Add(myVertexGraphic) Next Next End Sub | |
Requirements
Target Platforms: Windows XP Professional, Windows Server 2003 family, Windows Vista, Windows Server 2008 family, Windows 7