


 Syntax
| Visual Basic (Declaration) | |
|---|---|
Public Shared Function Densify( _ ByVal geom As Geometry, _ ByVal maxSegmentLength As Double _ ) As Geometry | |
| C# | |
|---|---|
public static Geometry Densify( Geometry geom, double maxSegmentLength ) | |
Remarks
The Geodesic.Densify algorithm takes an input Geometry (Polyline or Polygon) and returns that same Geometry type but with more verticies that give a better approximation of the shortest distance along a sphere.
The term Geodesic means calculating the shortest distance between two points on a sphere. Using Geodesic algorithms to calculate distances provides a highly accurate way to obtain length and area of measurements of geographic features. The Geodesic algorithm uses the concept of a great circle to obtain the shortest route between two points along the Earth’s surface. The length and area measurements obtained via the Geodesic functions are superior to those of the Euclidian functions, as the Euclidian functions are based upon a projection (i.e. a flat 2D representation of a 3D surface) which introduces distortion.
The Geodesic.Densify function is Shared/Static which means that you do not use the new keyword to instantiate it as an object. The input parameter maxSegmentLength for the Geodesic.Densify Method is the maximum segment length in meters.
The Polyline and Polygon Geometries that are used as parameters in the Geodesic functions require that the SpatialReference be in Geographic Coordinate System based upon latitude and longitude coordinates. The SpatialReference is a combination of an ellipsoid, datum, and a coordinate system used to display geographic data of the three dimensional Earth on a two dimensional surface (such as a piece of paper of computer monitor). A good article for describing how a spatial reference works can be found here. If the SpatialReference of the geometries in the layer are in a Projected Coordinate System then it will be required to converted those geometries into a Geographic Coordinate System via Methods like: Projection.WebMercator.ToGeographic or Tasks.GeometryService.ProjectAsync(IEnumerable<Graphic>,SpatialReference).
Parameters
- geom
- Geometry to densify.
- maxSegmentLength
- Maximum segment length in meters.
Return Value
Densified geometry.Example
How to use:
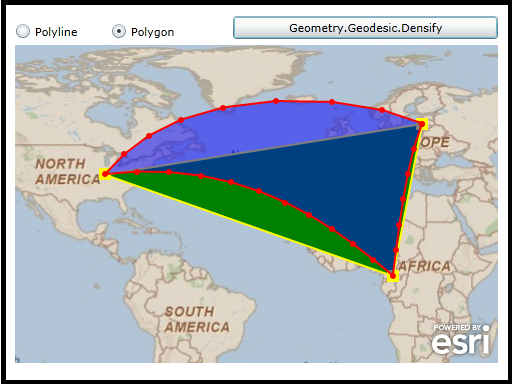
Click on a RadioButton (Polyline or Polygon) to draw a simple Graphic generated in code-behind on the Map Control (Note: the verticies that make up that Polyline or Polygon will also be added). Then click the Button add a new Graphic based upon the Geometry.Geodesic.Densify Method from the input Polyline or Polygon. Notice how the shape of the new Graphic is based upon the 'great circle' geodesic algorithm (Note: the verticies that make up the new Geodesic Polyline or Polygon will also be added).
The XAML code in this example is used in conjunction with the code-behind (C# or VB.NET) to demonstrate the functionality.
The following screen shot corresponds to the code example in this page.
| XAML |  Copy Code Copy Code |
|---|---|
<Grid x:Name="LayoutRoot"> <!-- Add a Map control. --> <esri:Map Background="White" HorizontalAlignment="Left" Margin="12,107,0,0" Name="Map1" VerticalAlignment="Top" Height="318" Width="483" WrapAround="True" Extent="-119.35,-27.77,50.44,84.02"> <!-- Add a backdrop ArcGISTiledMapServiceLayer. The SpatialReference = 4326 (Geographic Coordinate System).--> <esri:ArcGISTiledMapServiceLayer ID="PhysicalTiledLayer" Url="http://services.arcgisonline.com/ArcGIS/rest/services/ESRI_StreetMap_World_2D/MapServer"/> </esri:Map> <!-- Add two RadioButtons that use the same Click Event handlers to draw a Polyline or Polygon Graphics on the Map control in the code-behind. Each RadioButton has a 'Tag' attribute set that will be used to decide which Geometry type to draw. --> <RadioButton Content="Polyline" Height="16" HorizontalAlignment="Left" Margin="12,85,0,0" Name="rbPolyline" VerticalAlignment="Top" Tag="Polyline" Click="rb_Click"/> <RadioButton Content="Polygon" Height="16" HorizontalAlignment="Left" Margin="108,85,0,0" Name="rbPolygon" VerticalAlignment="Top" Tag="Polygon" Click="rb_Click"/> <!-- Add a button to perform a Geodesic.Densify on an existing Polyline or Polygon in the Map to create a 'densified' version of the same type and add it to the Map. --> <Button Content="Geometry.Geodesic.Densify" Height="23" HorizontalAlignment="Left" Margin="230,78,0,0" Name="Button_Geometry_GeoDesicDensify" VerticalAlignment="Top" Width="265" Click="Button_Geometry_GeoDesicDensify_Click" Visibility="Collapsed"/> <!-- Provide the instructions on how to use the sample code. --> <TextBlock Height="79" HorizontalAlignment="Left" Name="TextBlock1" VerticalAlignment="Top" Width="757" TextWrapping="Wrap" Text="Click on a RadioButton (Polyline or Polygon) to draw a simple Graphic generated in code-behind on the Map Control (Note: the verticies that make up that Polyline or Polygon will also be added). Then click the Button add a new Graphic based upon the Geometry.Geodesic.Densify Method from the input Polyline or Polygon. Notice how the shape of the new Graphic is based upon the 'great circle' geodesic algorithm (Note: the verticies that make up the new Geodesic Polyline or Polygon will also be added)." /> </Grid> | |
| C# | Copy Code |
|---|---|
private void rb_Click(object sender, System.Windows.RoutedEventArgs e) { // Cast the sender object to a RadioButton. System.Windows.Controls.RadioButton theRadioButton = (System.Windows.Controls.RadioButton)sender; // Get the Tag Property (a String) of the RadioButton that was set in XAML. Possible options for the Tag // Property are: "Polyline" and "Polygon". string theGraphicType = theRadioButton.Tag.ToString(); // Remove any existing GraphicsLayer objects that are in the Map. This allows the user to choose the // different RadioButtons over and over. if (Map1.Layers.Count > 1) { Map1.Layers.RemoveAt(1); } // Create a new instance of the GraphicsLayer object. ESRI.ArcGIS.Client.GraphicsLayer theGraphicsLayer = new ESRI.ArcGIS.Client.GraphicsLayer(); theGraphicsLayer.ID = "MyGraphicsLayer"; // Call the function that generates a single Graphic based upon the RadioButton Tag and add it to the GraphicsLayer. ESRI.ArcGIS.Client.Graphic theGraphic = GetAGraphicFromStaticSource(theGraphicType); theGraphicsLayer.Graphics.Add(theGraphic); // Add the GraphicsLayer to the Layers collection of the Map. Map1.Layers.Add(theGraphicsLayer); // Make the Button to perform the Geodesic.Densify work visible. Button_Geometry_GeoDesicDensify.Visibility = System.Windows.Visibility.Visible; // Add the verticies that make up the Graphic to the Map for easy visualization. AddVisualVertices(theGraphic, theGraphicsLayer, ESRI.ArcGIS.Client.Symbols.SimpleMarkerSymbol.SimpleMarkerStyle.Square, Colors.Yellow, 12); } private void Button_Geometry_GeoDesicDensify_Click(object sender, System.Windows.RoutedEventArgs e) { // Get the GraphicsLayer. ESRI.ArcGIS.Client.GraphicsLayer theGraphicsLayer = (ESRI.ArcGIS.Client.GraphicsLayer)(Map1.Layers["MyGraphicsLayer"]); // Create a new instance of one Graphic. ESRI.ArcGIS.Client.Graphic aGraphic = new ESRI.ArcGIS.Client.Graphic(); // Loop through all of the Graphics in the GraphicsLayer. foreach (ESRI.ArcGIS.Client.Graphic theGraphic in theGraphicsLayer) { // Get the Geometry from the Graphic. ESRI.ArcGIS.Client.Geometry.Geometry theGeometry = theGraphic.Geometry; // Create a placeholder for the new Geometry that will be created from the Shared/static Geometry.Geodesic.Densify Method. ESRI.ArcGIS.Client.Geometry.Geometry theGeometry2 = null; if ((theGeometry) is ESRI.ArcGIS.Client.Geometry.Polyline) { // For Polyline Geometries do the following: // Do the densification. theGeometry2 = ESRI.ArcGIS.Client.Geometry.Geodesic.Densify(theGeometry, 1000000); // Examples: 10, 100, 1000, 10000, 100000 // Create a new instance of a SimpleLineSymbol and set its Color, Style, and Width Properties. ESRI.ArcGIS.Client.Symbols.SimpleLineSymbol theSimpleLineSymbol = CreateSimpleLineSymbol(Colors.Red, ESRI.ArcGIS.Client.Symbols.SimpleLineSymbol.LineStyle.Solid, 2); // Apply the Graphic's Geometry and Symbol Properties. aGraphic.Geometry = theGeometry2; aGraphic.Symbol = (ESRI.ArcGIS.Client.Symbols.Symbol)theSimpleLineSymbol; } else if ((theGeometry) is ESRI.ArcGIS.Client.Geometry.Polygon) { // For Polygon Geometries do the following: // Do the densification. theGeometry2 = ESRI.ArcGIS.Client.Geometry.Geodesic.Densify(theGeometry, 1000000); // Examples: 10, 100, 1000, 10000, 100000 // Create a new instance of a SimpleFillSymbol and set its Color, BorderBrush, BorderThickness, and Opacity Properties. ESRI.ArcGIS.Client.Symbols.SimpleFillSymbol theSimpleFillSymbol = CreateSimpleFillSymbol(Colors.Blue, Colors.Red, 2, 0.5); // Apply the Graphic's Geometry and Symbol Properties. aGraphic.Geometry = theGeometry2; aGraphic.Symbol = (ESRI.ArcGIS.Client.Symbols.Symbol)theSimpleFillSymbol; } } // Add the 'densified' Graphics into the GraphicsLayer. theGraphicsLayer.Graphics.Add(aGraphic); // Add the verticies that make up the Graphic to the Map for easy visualization. AddVisualVertices(aGraphic, theGraphicsLayer, ESRI.ArcGIS.Client.Symbols.SimpleMarkerSymbol.SimpleMarkerStyle.Circle, Colors.Red, 6); } public void AddVisualVertices(ESRI.ArcGIS.Client.Graphic aGraphic, ESRI.ArcGIS.Client.GraphicsLayer theGraphicsLayer, ESRI.ArcGIS.Client.Symbols.SimpleMarkerSymbol.SimpleMarkerStyle theSimpleMarkerSytle, System.Windows.Media.Color theColor, double theSize) { // This function displays the verticies of the Densifiy Geometry. // Create an ObservableCollection<PointCollection> System.Collections.ObjectModel.ObservableCollection<ESRI.ArcGIS.Client.Geometry.PointCollection> theCollectonOfPointCollections = null; if (aGraphic.Geometry is ESRI.ArcGIS.Client.Geometry.Polyline) { // For Polyline Geometries do the following: // Cast the generic Geometry into a Polyline. ESRI.ArcGIS.Client.Geometry.Polyline theDensifiedPolyline = (ESRI.ArcGIS.Client.Geometry.Polyline)aGraphic.Geometry; // Set the ObservableCollecton<PointCollection> to the Polyline.Paths theCollectonOfPointCollections = theDensifiedPolyline.Paths; } else if (aGraphic.Geometry is ESRI.ArcGIS.Client.Geometry.Polygon) { // For Polygon Geometries do the following: // Cast the generic Geometry into a Polygon. ESRI.ArcGIS.Client.Geometry.Polygon theDensifiedPolygon = (ESRI.ArcGIS.Client.Geometry.Polygon)aGraphic.Geometry; // Set the ObservableCollecton<PointCollection>) to the Polygon.Rings theCollectonOfPointCollections = theDensifiedPolygon.Rings; } // We are only interested in the first PointCollection. ESRI.ArcGIS.Client.Geometry.PointCollection theFirstPointCollection = theCollectonOfPointCollections[0]; // Loop through each MapPoint in the first PointCollection. foreach (ESRI.ArcGIS.Client.Geometry.MapPoint theMapPoint in theFirstPointCollection) { // Create a SimpleMarkerSymbol and set it's Color, Size, and Style. ESRI.ArcGIS.Client.Symbols.SimpleMarkerSymbol theSimpleMarkerSymbol = new ESRI.ArcGIS.Client.Symbols.SimpleMarkerSymbol(); theSimpleMarkerSymbol.Color = new System.Windows.Media.SolidColorBrush(theColor); theSimpleMarkerSymbol.Size = theSize; theSimpleMarkerSymbol.Style = theSimpleMarkerSytle; // Create a new Graphic based upon the MapPoint's of the densified Geometry. Use the SimpleMarkerSymbol just defined. ESRI.ArcGIS.Client.Graphic theGraphic = new ESRI.ArcGIS.Client.Graphic(); ESRI.ArcGIS.Client.Geometry.MapPoint densifyGeometry = new ESRI.ArcGIS.Client.Geometry.MapPoint(theMapPoint.X, theMapPoint.Y); theGraphic.Geometry = densifyGeometry; theGraphic.Symbol = theSimpleMarkerSymbol; // Add the new Graphic to the GraphicsLayer. theGraphicsLayer.Graphics.Add(theGraphic); } } #region Utility Functions public ESRI.ArcGIS.Client.Graphic GetAGraphicFromStaticSource(string theGraphicType) { // Create a new instance of one Graphic. ESRI.ArcGIS.Client.Graphic theGraphic = new ESRI.ArcGIS.Client.Graphic(); // Create a SpatialReference for the Graphic using the Geographic Coordinate System of WKID=4326. ESRI.ArcGIS.Client.Geometry.SpatialReference theSpatialReference = new ESRI.ArcGIS.Client.Geometry.SpatialReference(4326); // Create a new PointCollection used to add vertices to the Geometry. ESRI.ArcGIS.Client.Geometry.PointCollection thePointCollection = new ESRI.ArcGIS.Client.Geometry.PointCollection(); // Generate a single Graphic based upon the user-specified type to be created. if (theGraphicType == "Polyline") { // Add MapPoints into the PointCollection. AddMapPointsToPointCollection(14.94, 50.11, theSpatialReference, thePointCollection); AddMapPointsToPointCollection(-87.82, 30.65, theSpatialReference, thePointCollection); // The PointCollection needs to be added to a new instance of an ObservableCollection. System.Collections.ObjectModel.ObservableCollection<ESRI.ArcGIS.Client.Geometry.PointCollection> theObservableCollection = new System.Collections.ObjectModel.ObservableCollection<ESRI.ArcGIS.Client.Geometry.PointCollection>(); theObservableCollection.Add(thePointCollection); // Create a new instance of a Polyline object and set the Paths and SpatialReference Properties. ESRI.ArcGIS.Client.Geometry.Polyline thePolyline = new ESRI.ArcGIS.Client.Geometry.Polyline(); thePolyline.Paths = theObservableCollection; thePolyline.SpatialReference = theSpatialReference; // Create a new instance of a SimpleLineSymbol and set its Color, Style, and Width Properties. ESRI.ArcGIS.Client.Symbols.SimpleLineSymbol theSimpleLineSymbol = CreateSimpleLineSymbol(Colors.Yellow, ESRI.ArcGIS.Client.Symbols.SimpleLineSymbol.LineStyle.Solid, 2); // Apply the Graphic's Geometry and Symbol Properties. theGraphic.Geometry = (ESRI.ArcGIS.Client.Geometry.Geometry)thePolyline; theGraphic.Symbol = (ESRI.ArcGIS.Client.Symbols.Symbol)theSimpleLineSymbol; } else if (theGraphicType == "Polygon") { // Add MapPoints into the PointCollection. AddMapPointsToPointCollection(23.66, 56.42, theSpatialReference, thePointCollection); AddMapPointsToPointCollection(13.39, 2.95, theSpatialReference, thePointCollection); AddMapPointsToPointCollection(-87.82, 38.58, theSpatialReference, thePointCollection); AddMapPointsToPointCollection(23.66, 56.42, theSpatialReference, thePointCollection); // The PointCollection needs to be added to a new instance of an ObservableCollection. System.Collections.ObjectModel.ObservableCollection<ESRI.ArcGIS.Client.Geometry.PointCollection> theObservableCollection = new System.Collections.ObjectModel.ObservableCollection<ESRI.ArcGIS.Client.Geometry.PointCollection>(); theObservableCollection.Add(thePointCollection); // Create a new instance of a Polygon object and set the Rings and SpatialReference Properties. ESRI.ArcGIS.Client.Geometry.Polygon thePolygon = new ESRI.ArcGIS.Client.Geometry.Polygon(); thePolygon.Rings = theObservableCollection; thePolygon.SpatialReference = theSpatialReference; // Create a new instance of a SimpleFillSymbol and set its Color, BorderBrush, BorderThickness, and Opacity Properties. ESRI.ArcGIS.Client.Symbols.SimpleFillSymbol theSimpleFillSymbol = CreateSimpleFillSymbol(Colors.Green, Colors.Yellow, 2, 1); // Apply the Graphic's Geometry and Symbol Properties. theGraphic.Geometry = (ESRI.ArcGIS.Client.Geometry.Geometry)thePolygon; theGraphic.Symbol = (ESRI.ArcGIS.Client.Symbols.Symbol)theSimpleFillSymbol; } // Return the created Graphic. return theGraphic; } public void AddMapPointsToPointCollection(double theX, double theY, ESRI.ArcGIS.Client.Geometry.SpatialReference theSpatialReference, ESRI.ArcGIS.Client.Geometry.PointCollection thePointCollection) { // Utility function to create and add a MapPoint to a PointCollection. ESRI.ArcGIS.Client.Geometry.MapPoint theMapPoint = new ESRI.ArcGIS.Client.Geometry.MapPoint(theX, theY, theSpatialReference); thePointCollection.Add(theMapPoint); } public ESRI.ArcGIS.Client.Symbols.SimpleFillSymbol CreateSimpleFillSymbol(System.Windows.Media.Color theFillColor, System.Windows.Media.Color theBorderBrushColor, double theBorderThickness, double theOpacity) { // Utility function to create a SimpleFillSymbol with various Properties. ESRI.ArcGIS.Client.Symbols.SimpleFillSymbol theSimpleFillSymbol = new ESRI.ArcGIS.Client.Symbols.SimpleFillSymbol(); theSimpleFillSymbol.Fill = new System.Windows.Media.SolidColorBrush(theFillColor); theSimpleFillSymbol.BorderBrush = new System.Windows.Media.SolidColorBrush(theBorderBrushColor); theSimpleFillSymbol.BorderThickness = theBorderThickness; theSimpleFillSymbol.Fill.Opacity = theOpacity; return (theSimpleFillSymbol); } public ESRI.ArcGIS.Client.Symbols.SimpleLineSymbol CreateSimpleLineSymbol(System.Windows.Media.Color theColor, ESRI.ArcGIS.Client.Symbols.SimpleLineSymbol.LineStyle theStyle, double theWidth) { // Utility function to create a SimpleLineSymbol with various Properties. ESRI.ArcGIS.Client.Symbols.SimpleLineSymbol theSimpleLineSymbol = new ESRI.ArcGIS.Client.Symbols.SimpleLineSymbol(); theSimpleLineSymbol.Color = new System.Windows.Media.SolidColorBrush(theColor); theSimpleLineSymbol.Style = theStyle; theSimpleLineSymbol.Width = theWidth; return theSimpleLineSymbol; } #endregion | |
| VB.NET | Copy Code |
|---|---|
Private Sub rb_Click(ByVal sender As System.Object, ByVal e As System.Windows.RoutedEventArgs) ' Cast the sender object to a RadioButton. Dim theRadioButton As System.Windows.Controls.RadioButton = CType(sender, System.Windows.Controls.RadioButton) ' Get the Tag Property (a String) of the RadioButton that was set in XAML. Possible options for the Tag ' Property are: "Polyline" and "Polygon". Dim theGraphicType As String = theRadioButton.Tag.ToString ' Remove any existing GraphicsLayer objects that are in the Map. This allows the user to choose the ' different RadioButtons over and over. If Map1.Layers.Count > 1 Then Map1.Layers.RemoveAt(1) End If ' Create a new instance of the GraphicsLayer object. Dim theGraphicsLayer As New ESRI.ArcGIS.Client.GraphicsLayer theGraphicsLayer.ID = "MyGraphicsLayer" ' Call the function that generates a single Graphic based upon the RadioButton Tag and add it to the GraphicsLayer. Dim theGraphic As ESRI.ArcGIS.Client.Graphic = GetAGraphicFromStaticSource(theGraphicType) theGraphicsLayer.Graphics.Add(theGraphic) ' Add the GraphicsLayer to the Layers collection of the Map. Map1.Layers.Add(theGraphicsLayer) ' Make the Button to perform the Geodesic.Densify work visible. Button_Geometry_GeoDesicDensify.Visibility = Windows.Visibility.Visible ' Add the verticies that make up the Graphic to the Map for easy visualization. AddVisualVertices(theGraphic, theGraphicsLayer, ESRI.ArcGIS.Client.Symbols.SimpleMarkerSymbol.SimpleMarkerStyle.Square, Colors.Yellow, 12) End Sub Private Sub Button_Geometry_GeoDesicDensify_Click(ByVal sender As System.Object, ByVal e As System.Windows.RoutedEventArgs) ' Get the GraphicsLayer. Dim theGraphicsLayer As ESRI.ArcGIS.Client.GraphicsLayer = CType(Map1.Layers("MyGraphicsLayer"), ESRI.ArcGIS.Client.GraphicsLayer) ' Create a new instance of one Graphic. Dim aGraphic As New ESRI.ArcGIS.Client.Graphic ' Loop through all of the Graphics in the GraphicsLayer. For Each theGraphic As ESRI.ArcGIS.Client.Graphic In theGraphicsLayer ' Get the Geometry from the Graphic. Dim theGeometry As ESRI.ArcGIS.Client.Geometry.Geometry = theGraphic.Geometry ' Create a placeholder for the new Geometry that will be created from the Shared/static Geometry.Geodesic.Densify Method. Dim theGeometry2 As ESRI.ArcGIS.Client.Geometry.Geometry If TypeOf (theGeometry) Is ESRI.ArcGIS.Client.Geometry.Polyline Then ' For Polyline Geometries do the following: ' Do the densification. theGeometry2 = ESRI.ArcGIS.Client.Geometry.Geodesic.Densify(theGeometry, 1000000) ' Examples: 10, 100, 1000, 10000, 100000 ' Create a new instance of a SimpleLineSymbol and set its Color, Style, and Width Properties. Dim theSimpleLineSymbol As ESRI.ArcGIS.Client.Symbols.SimpleLineSymbol = CreateSimpleLineSymbol(Colors.Red, ESRI.ArcGIS.Client.Symbols.SimpleLineSymbol.LineStyle.Solid, 2) ' Apply the Graphic's Geometry and Symbol Properties. aGraphic.Geometry = theGeometry2 aGraphic.Symbol = CType(theSimpleLineSymbol, ESRI.ArcGIS.Client.Symbols.Symbol) ElseIf TypeOf (theGeometry) Is ESRI.ArcGIS.Client.Geometry.Polygon Then ' For Polygon Geometries do the following: ' Do the densification. theGeometry2 = ESRI.ArcGIS.Client.Geometry.Geodesic.Densify(theGeometry, 1000000) ' Examples: 10, 100, 1000, 10000, 100000 ' Create a new instance of a SimpleFillSymbol and set its Color, BorderBrush, BorderThickness, and Opacity Properties. Dim theSimpleFillSymbol As ESRI.ArcGIS.Client.Symbols.SimpleFillSymbol = CreateSimpleFillSymbol(Colors.Blue, Colors.Red, 2, 0.5) ' Apply the Graphic's Geometry and Symbol Properties. aGraphic.Geometry = theGeometry2 aGraphic.Symbol = CType(theSimpleFillSymbol, ESRI.ArcGIS.Client.Symbols.Symbol) End If Next ' Add the 'densified' Graphics into the GraphicsLayer. theGraphicsLayer.Graphics.Add(aGraphic) ' Add the verticies that make up the Graphic to the Map for easy visualization. AddVisualVertices(aGraphic, theGraphicsLayer, ESRI.ArcGIS.Client.Symbols.SimpleMarkerSymbol.SimpleMarkerStyle.Circle, Colors.Red, 6) End Sub Public Sub AddVisualVertices(aGraphic As ESRI.ArcGIS.Client.Graphic, theGraphicsLayer As ESRI.ArcGIS.Client.GraphicsLayer, theSimpleMarkerSytle As ESRI.ArcGIS.Client.Symbols.SimpleMarkerSymbol.SimpleMarkerStyle, theColor As System.Windows.Media.Color, theSize As Double) ' This function displays the verticies of the Densifiy Geometry. ' Create an ObservableCollection(Of PointCollection) Dim theCollectonOfPointCollections As Collections.ObjectModel.ObservableCollection(Of ESRI.ArcGIS.Client.Geometry.PointCollection) = Nothing If TypeOf aGraphic.Geometry Is ESRI.ArcGIS.Client.Geometry.Polyline Then ' For Polyline Geometries do the following: ' Cast the generic Geometry into a Polyline. Dim theDensifiedPolyline As ESRI.ArcGIS.Client.Geometry.Polyline = CType(aGraphic.Geometry, ESRI.ArcGIS.Client.Geometry.Polyline) ' Set the ObservableCollecton(Of PointCollection) to the Polyline.Paths theCollectonOfPointCollections = theDensifiedPolyline.Paths ElseIf TypeOf aGraphic.Geometry Is ESRI.ArcGIS.Client.Geometry.Polygon Then ' For Polygon Geometries do the following: ' Cast the generic Geometry into a Polygon. Dim theDensifiedPolygon As ESRI.ArcGIS.Client.Geometry.Polygon = CType(aGraphic.Geometry, ESRI.ArcGIS.Client.Geometry.Polygon) ' Set the ObservableCollecton(Of PointCollection) to the Polygon.Rings theCollectonOfPointCollections = theDensifiedPolygon.Rings End If ' We are only interested in the first PointCollection. Dim theFirstPointCollection As ESRI.ArcGIS.Client.Geometry.PointCollection = theCollectonOfPointCollections.Item(0) ' Loop through each MapPoint in the first PointCollection. For Each theMapPoint As ESRI.ArcGIS.Client.Geometry.MapPoint In theFirstPointCollection ' Create a SimpleMarkerSymbol and set it's Color, Size, and Style. Dim theSimpleMarkerSymbol As New ESRI.ArcGIS.Client.Symbols.SimpleMarkerSymbol theSimpleMarkerSymbol.Color = New System.Windows.Media.SolidColorBrush(theColor) theSimpleMarkerSymbol.Size = theSize theSimpleMarkerSymbol.Style = theSimpleMarkerSytle ' Create a new Graphic based upon the MapPoint's of the densified Geometry. Use the SimpleMarkerSymbol just defined. Dim theGraphic As New ESRI.ArcGIS.Client.Graphic Dim densifyGeometry As New ESRI.ArcGIS.Client.Geometry.MapPoint(theMapPoint.X, theMapPoint.Y) theGraphic.Geometry = densifyGeometry theGraphic.Symbol = theSimpleMarkerSymbol ' Add the new Graphic to the GraphicsLayer. theGraphicsLayer.Graphics.Add(theGraphic) Next End Sub #Region "Utility Functions" Public Function GetAGraphicFromStaticSource(ByVal theGraphicType As String) As ESRI.ArcGIS.Client.Graphic ' Create a new instance of one Graphic. Dim theGraphic As New ESRI.ArcGIS.Client.Graphic ' Create a SpatialReference for the Graphic using the Geographic Coordinate System of WKID=4326. Dim theSpatialReference As New ESRI.ArcGIS.Client.Geometry.SpatialReference(4326) ' Create a new PointCollection used to add vertices to the Geometry. Dim thePointCollection As New ESRI.ArcGIS.Client.Geometry.PointCollection ' Generate a single Graphic based upon the user-specified type to be created. If theGraphicType = "Polyline" Then ' Add MapPoints into the PointCollection. AddMapPointsToPointCollection(14.94, 50.11, theSpatialReference, thePointCollection) AddMapPointsToPointCollection(-87.82, 30.65, theSpatialReference, thePointCollection) ' The PointCollection needs to be added to a new instance of an ObservableCollection. Dim theObservableCollection As New System.Collections.ObjectModel.ObservableCollection(Of ESRI.ArcGIS.Client.Geometry.PointCollection) theObservableCollection.Add(thePointCollection) ' Create a new instance of a Polyline object and set the Paths and SpatialReference Properties. Dim thePolyline As New ESRI.ArcGIS.Client.Geometry.Polyline thePolyline.Paths = theObservableCollection thePolyline.SpatialReference = theSpatialReference ' Create a new instance of a SimpleLineSymbol and set its Color, Style, and Width Properties. Dim theSimpleLineSymbol As ESRI.ArcGIS.Client.Symbols.SimpleLineSymbol = CreateSimpleLineSymbol(Colors.Yellow, ESRI.ArcGIS.Client.Symbols.SimpleLineSymbol.LineStyle.Solid, 2) ' Apply the Graphic's Geometry and Symbol Properties. theGraphic.Geometry = CType(thePolyline, ESRI.ArcGIS.Client.Geometry.Geometry) theGraphic.Symbol = CType(theSimpleLineSymbol, ESRI.ArcGIS.Client.Symbols.Symbol) ElseIf theGraphicType = "Polygon" Then ' Add MapPoints into the PointCollection. AddMapPointsToPointCollection(23.66, 56.42, theSpatialReference, thePointCollection) AddMapPointsToPointCollection(13.39, 2.95, theSpatialReference, thePointCollection) AddMapPointsToPointCollection(-87.82, 38.58, theSpatialReference, thePointCollection) AddMapPointsToPointCollection(23.66, 56.42, theSpatialReference, thePointCollection) ' The PointCollection needs to be added to a new instance of an ObservableCollection. Dim theObservableCollection As New System.Collections.ObjectModel.ObservableCollection(Of ESRI.ArcGIS.Client.Geometry.PointCollection) theObservableCollection.Add(thePointCollection) ' Create a new instance of a Polygon object and set the Rings and SpatialReference Properties. Dim thePolygon As New ESRI.ArcGIS.Client.Geometry.Polygon thePolygon.Rings = theObservableCollection thePolygon.SpatialReference = theSpatialReference ' Create a new instance of a SimpleFillSymbol and set its Color, BorderBrush, BorderThickness, and Opacity Properties. Dim theSimpleFillSymbol As ESRI.ArcGIS.Client.Symbols.SimpleFillSymbol = CreateSimpleFillSymbol(Colors.Green, Colors.Yellow, 2, 1) ' Apply the Graphic's Geometry and Symbol Properties. theGraphic.Geometry = CType(thePolygon, ESRI.ArcGIS.Client.Geometry.Geometry) theGraphic.Symbol = CType(theSimpleFillSymbol, ESRI.ArcGIS.Client.Symbols.Symbol) End If ' Return the created Graphic. Return theGraphic End Function Public Sub AddMapPointsToPointCollection(theX As Double, theY As Double, theSpatialReference As ESRI.ArcGIS.Client.Geometry.SpatialReference, thePointCollection As ESRI.ArcGIS.Client.Geometry.PointCollection) ' Utility function to create and add a MapPoint to a PointCollection. Dim theMapPoint As New ESRI.ArcGIS.Client.Geometry.MapPoint(theX, theY, theSpatialReference) thePointCollection.Add(theMapPoint) End Sub Public Function CreateSimpleFillSymbol(theFillColor As System.Windows.Media.Color, theBorderBrushColor As System.Windows.Media.Color, theBorderThickness As Double, theOpacity As Double) As ESRI.ArcGIS.Client.Symbols.SimpleFillSymbol ' Utility function to create a SimpleFillSymbol with various Properties. Dim theSimpleFillSymbol As New ESRI.ArcGIS.Client.Symbols.SimpleFillSymbol theSimpleFillSymbol.Fill = New System.Windows.Media.SolidColorBrush(theFillColor) theSimpleFillSymbol.BorderBrush = New System.Windows.Media.SolidColorBrush(theBorderBrushColor) theSimpleFillSymbol.BorderThickness = theBorderThickness theSimpleFillSymbol.Fill.Opacity = theOpacity Return (theSimpleFillSymbol) End Function Public Function CreateSimpleLineSymbol(theColor As System.Windows.Media.Color, theStyle As ESRI.ArcGIS.Client.Symbols.SimpleLineSymbol.LineStyle, theWidth As Double) As ESRI.ArcGIS.Client.Symbols.SimpleLineSymbol ' Utility function to create a SimpleLineSymbol with various Properties. Dim theSimpleLineSymbol As New ESRI.ArcGIS.Client.Symbols.SimpleLineSymbol theSimpleLineSymbol.Color = New System.Windows.Media.SolidColorBrush(theColor) theSimpleLineSymbol.Style = theStyle theSimpleLineSymbol.Width = theWidth Return theSimpleLineSymbol End Function #End Region | |
Requirements
Target Platforms: Windows XP Professional, Windows Server 2003 family, Windows Vista, Windows Server 2008 family, Windows 7