


 Syntax
| Visual Basic (Declaration) | |
|---|---|
Public ReadOnly Property Attributes As IDictionary(Of String,Object) | |
| C# | |
|---|---|
public IDictionary<string,object> Attributes {get;} | |
Remarks
An Attribute is data (typically textual) that describes the geographic characteristics of a feature. There are many useful purposes for having attributes associated with a Graphic, including:
- Provide a basis for performing symbolic rendering. Example: coloring State polygon Graphics differently based upon population (see the code example in this document).
- Provide information in a MapTip so that users can see information when they hover the mouse/cursor/pointer over the Graphic. (see the Graphic.MapTip for a code example).
- Provide a source for displaying information in a Table. This is especially helpful when selecting a record in the table automatically highlights the Graphic feature in the Map (see the interactive SDK sample Find). And conversely, selecting a Graphic feature in the Map automatically highlights the attributes for a particular record in the table.
- Provide a mechanism for selecting/filtering Graphics based upon the result of a Task (Query, Identify, Find, Address locator, Geometry, Geoprocessing, and Route).
Adding new Attribute values to a Graphic is performed in the code-behind (see the code example for Graphic.MapTip).
Attribute information can be provided automatically as part of a returned FeatureSet from an Tasks.QueryTask operation of an ArcGIS Server map service (see the code example in this document). When using the Tasks.Query as the argument in the Tasks.QueryTask to obtain Attributes, to return all fields specify the wildcard '*' as the value of the Tasks.Query.OutFields parameter. The wildcard will not return the geometry (i.e. shape field). In order to return the geometry information the Tasks.Query.ReturnGeometry must be set to True.
The Graphic.Attributes gets a ReadOnly IDictionary(Of String, Object) object. This object is used to store the a collection of key/value pairs. The key is the name of the attribute. The value is the attribute information. When a Graphic is created, the IDictionary(Of String, Object) object is also created. Although the Graphic.Attributes Property is ReadOnly, meaning you can only get the IDictionary(Of String, Object) object, you can use the regular IDictionary Members to like: Add, Clear, Remove, etc. to define how the IDictionary behaves. NOTE: You cannot create an new instance of the IDictionary(Of String, Object) object and set it to the Graphics.Attributes Property, use the IDictionary.Add Property instead.
Example
How to use:
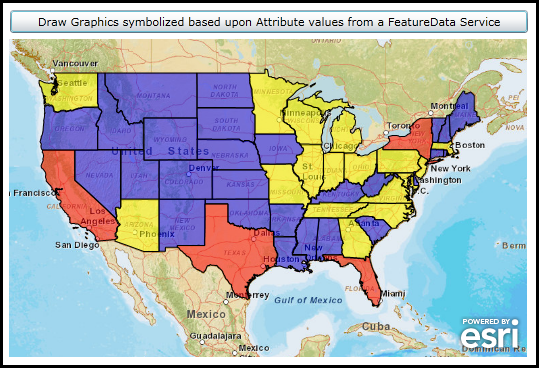
Click the button to perform a QueryTask web service. The function will iterate over the resulting FeatureSet from the web service to symbolize the Graphics based upon Attribute values. States populations will be displayed in Red (high), Yellow (medium) and Blue (low).
The XAML code in this example is used in conjunction with the code-behind (C# or VB.NET) to demonstrate the functionality.
The following screen shot corresponds to the code example in this page.
| XAML |  Copy Code Copy Code |
|---|---|
<Grid x:Name="LayoutRoot"> <!-- Add a Map control with an ArcGISTiledMapServiceLayer. Set the Map.Extent to that of the Continental United States using the Spatial Reference WKT of 102100 coordinate values. --> <esri:Map Background="White" HorizontalAlignment="Left" Margin="12,136,0,0" Name="Map1" VerticalAlignment="Top" Height="318" Width="518" Extent="-14319453,2145784,-6782898,6772471"> <esri:ArcGISTiledMapServiceLayer ID="PhysicalTiledLayer" Url="http://services.arcgisonline.com/ArcGIS/rest/services/World_Street_Map/MapServer" /> </esri:Map> <!-- Provide the instructions on how to use the sample code. --> <TextBlock Height="72" HorizontalAlignment="Left" Name="TextBlock1" VerticalAlignment="Top" Width="503" TextWrapping="Wrap" Margin="12,29,0,0" Text="Click the button to perform a QueryTask web service. The function will iterate over the resulting FeatureSet from the web service to symbolize the Graphics based upon Attribute values. States populations will be displayed in Red (high), Yellow (medium) and Blue (low)." /> <!-- Add a Button to perform the work. Note the Click Event handler is wired-up to use code-behind. --> <Button Content="Draw Graphics symbolized based upon Attribute values from a FeatureData Service" Height="23" HorizontalAlignment="Left" Margin="12,107,0,0" Name="Button2" VerticalAlignment="Top" Width="518" Click="Button2_Click"/> </Grid> | |
| C# | Copy Code |
|---|---|
private void Button2_Click(object sender, System.Windows.RoutedEventArgs e) { // This function will execute a QueryTask Asynchronously to obtain all of the US States from an ArcGIS Server // web service. // When performing a ESRI.ArcGIS.Client.Tasks.Query use the Query.Geometry Property for the web service that // corresponds to the dataset being queried // (i.e. http://sampleserver1.arcgisonline.com/ArcGIS/rest/services/Demographics/ESRI_Census_USA/MapServer/5). // In this example, the web service is based upon Spatial Reference WKT of 4269 which uses standard latitude // longitude spherical coordinates (i.e. -180 to 180). // The Query.OutSpatialReference Property defines what the returned FeatureSet from the web service will be in. // In this example the data will be projected to Spatial Reference WKT of 102100 which uses a Web Mercator // Auxiliary Sphere. ESRI.ArcGIS.Client.Tasks.Query query = new ESRI.ArcGIS.Client.Tasks.Query(); query.Geometry = new ESRI.ArcGIS.Client.Geometry.Envelope(-180, 0, 0, 90); query.OutSpatialReference = Map1.SpatialReference; // Specify that all of the Attributes from the web service FeatureSet will be returned. query.OutFields.Add("*"); // Allow geometry (i.e. shapes) to be returned as part of the Query. query.ReturnGeometry = true; // Define the QueryTask by specifying the URL of the FeatureLayer to be queried. ESRI.ArcGIS.Client.Tasks.QueryTask queryTask = new ESRI.ArcGIS.Client.Tasks.QueryTask("http://sampleserver1.arcgisonline.com/ArcGIS/rest/services/Demographics/ESRI_Census_USA/MapServer/5"); // Wire up an Event Handler that will execute when the Query Task is completed from the web service. queryTask.ExecuteCompleted += StatesGraphicsLayerQueryTask_ExecuteCompleted; // Execute the QueryTask Asymchronously. queryTask.ExecuteAsync(query); } private void StatesGraphicsLayerQueryTask_ExecuteCompleted(object sender, ESRI.ArcGIS.Client.Tasks.QueryEventArgs queryArgs) { // This function executes after the QueryTask has completed. If there is a valid FeatureSet returned then // symbolize the US States based upon the Attribute of "POP2007" (i.e. Population count for the year 2007). // Check to ensure we have valid return results. if (queryArgs.FeatureSet == null) { return; } // Obtain a FeatureSet from the queryArgs returned from the web service. ESRI.ArcGIS.Client.Tasks.FeatureSet resultFeatureSet = queryArgs.FeatureSet; // Create three different SimpleFillSymbols to visually display what US States have High, Medium, and // Low populations. ESRI.ArcGIS.Client.Symbols.SimpleFillSymbol aSimpleFillSymbol_High = new ESRI.ArcGIS.Client.Symbols.SimpleFillSymbol(); System.Windows.Media.SolidColorBrush aSolidColorBrush_Red = new System.Windows.Media.SolidColorBrush(Colors.Red); aSolidColorBrush_Red.Opacity = 0.5; aSimpleFillSymbol_High.Fill = aSolidColorBrush_Red; ESRI.ArcGIS.Client.Symbols.SimpleFillSymbol aSimpleFillSymbol_Medium = new ESRI.ArcGIS.Client.Symbols.SimpleFillSymbol(); System.Windows.Media.SolidColorBrush aSolidColorBrush_Yellow = new System.Windows.Media.SolidColorBrush(Colors.Yellow); aSolidColorBrush_Yellow.Opacity = 0.5; aSimpleFillSymbol_Medium.Fill = aSolidColorBrush_Yellow; ESRI.ArcGIS.Client.Symbols.SimpleFillSymbol aSimpleFillSymbol_Low = new ESRI.ArcGIS.Client.Symbols.SimpleFillSymbol(); System.Windows.Media.SolidColorBrush aSolidColorBrush_Blue = new System.Windows.Media.SolidColorBrush(Colors.Blue); aSolidColorBrush_Blue.Opacity = 0.5; aSimpleFillSymbol_Low.Fill = aSolidColorBrush_Blue; // Create a new GraphicsLayer to add to the Map Control. The individual Graphic objects will come // from the returned FeatureSet. ESRI.ArcGIS.Client.GraphicsLayer myGraphicsLayer = new ESRI.ArcGIS.Client.GraphicsLayer(); // Ensure the we have a FeatureSet with data. if (resultFeatureSet != null & resultFeatureSet.Features.Count > 0) { // Iterate over each feature (which is a Graphic object) in the FeatureSet. foreach (ESRI.ArcGIS.Client.Graphic graphicFeature in resultFeatureSet.Features) { // Determine which US State based upon their Attribute "POP2007" value will be assigned a specific // SimpleFillSymbol. if ((int)graphicFeature.Attributes["POP2007"] > 15000000) { graphicFeature.Symbol = aSimpleFillSymbol_High as ESRI.ArcGIS.Client.Symbols.Symbol; } else if ((int)graphicFeature.Attributes["POP2007"] > 5000000) { graphicFeature.Symbol = aSimpleFillSymbol_Medium as ESRI.ArcGIS.Client.Symbols.Symbol; } else { graphicFeature.Symbol = aSimpleFillSymbol_Low as ESRI.ArcGIS.Client.Symbols.Symbol; } // // Note: there are numerous graphicFeature.Attribute items that can be used for symbolization. // // As an experiment try uncommenting the next few lines of code to see all of the different // // types of attribute information available. //System.Text.StringBuilder myStringBuilderDisplayText = new System.Text.StringBuilder(); //System.Collections.Generic.IDictionary<string, object> allAttributes = graphicFeature.Attributes; //foreach (string oneKey in allAttributes.Keys) //{ // object theValue = allAttributes[oneKey]; // myStringBuilderDisplayText.Append(oneKey + ": " + theValue.ToString() + Environment.NewLine); //} //MessageBox.Show(myStringBuilderDisplayText.ToString()); // Add the Graphic to the GraphicsLayer myGraphicsLayer.Graphics.Add(graphicFeature); } } // Add the GraphicsLayer to the Map. It will automatically draw, there is not a need for a refresh. Map1.Layers.Add(myGraphicsLayer); } | |
| VB.NET | Copy Code |
|---|---|
Private Sub Button2_Click(ByVal sender As System.Object, ByVal e As System.Windows.RoutedEventArgs) ' This function will execute a QueryTask Asynchronously to obtain all of the US States from an ArcGIS Server ' web service. ' When performing a ESRI.ArcGIS.Client.Tasks.Query use the Query.Geometry Property for the web service that ' corresponds to the dataset being queried ' (i.e. http://sampleserver1.arcgisonline.com/ArcGIS/rest/services/Demographics/ESRI_Census_USA/MapServer/5). ' In this example, the web service is based upon Spatial Reference WKT of 4269 which uses standard latitude ' longitude spherical coordinates (i.e. -180 to 180). ' The Query.OutSpatialReference Property defines what the returned FeatureSet from the web service will be in. ' In this example the data will be projected to Spatial Reference WKT of 102100 which uses a Web Mercator ' Auxiliary Sphere. Dim query As New ESRI.ArcGIS.Client.Tasks.Query() With { .Geometry = New ESRI.ArcGIS.Client.Geometry.Envelope(-180, 0, 0, 90), .OutSpatialReference = Map1.SpatialReference } ' Specify that all of the Attributes from the web service FeatureSet will be returned. query.OutFields.Add("*") ' Allow geometry (i.e. shapes) to be returned as part of the Query. query.ReturnGeometry = True ' Define the QueryTask by specifying the URL of the FeatureLayer to be queried. Dim queryTask As New ESRI.ArcGIS.Client.Tasks.QueryTask("http://sampleserver1.arcgisonline.com/ArcGIS/rest/services/Demographics/ESRI_Census_USA/MapServer/5") ' Wire up an Event Handler that will execute when the Query Task is completed from the web service. AddHandler queryTask.ExecuteCompleted, AddressOf StatesGraphicsLayerQueryTask_ExecuteCompleted ' Execute the QueryTask Asymchronously. queryTask.ExecuteAsync(query) End Sub Private Sub StatesGraphicsLayerQueryTask_ExecuteCompleted(ByVal sender As Object, ByVal queryArgs As ESRI.ArcGIS.Client.Tasks.QueryEventArgs) ' This function executes after the QueryTask has completed. If there is a valid FeatureSet returned then ' symbolize the US States based upon the Attribute of "POP2007" (i.e. Population count for the year 2007). ' Check to ensure we have valid return results. If queryArgs.FeatureSet Is Nothing Then Return End If ' Obtain a FeatureSet from the queryArgs returned from the web service. Dim resultFeatureSet As ESRI.ArcGIS.Client.Tasks.FeatureSet = queryArgs.FeatureSet ' Create three different SimpleFillSymbols to visually display what US States have High, Medium, and ' Low populations. Dim aSimpleFillSymbol_High As New ESRI.ArcGIS.Client.Symbols.SimpleFillSymbol Dim aSolidColorBrush_Red As New System.Windows.Media.SolidColorBrush(Colors.Red) aSolidColorBrush_Red.Opacity = 0.5 aSimpleFillSymbol_High.Fill = aSolidColorBrush_Red Dim aSimpleFillSymbol_Medium As New ESRI.ArcGIS.Client.Symbols.SimpleFillSymbol Dim aSolidColorBrush_Yellow As New System.Windows.Media.SolidColorBrush(Colors.Yellow) aSolidColorBrush_Yellow.Opacity = 0.5 aSimpleFillSymbol_Medium.Fill = aSolidColorBrush_Yellow Dim aSimpleFillSymbol_Low As New ESRI.ArcGIS.Client.Symbols.SimpleFillSymbol Dim aSolidColorBrush_Blue As New System.Windows.Media.SolidColorBrush(Colors.Blue) aSolidColorBrush_Blue.Opacity = 0.5 aSimpleFillSymbol_Low.Fill = aSolidColorBrush_Blue ' Create a new GraphicsLayer to add to the Map Control. The individual Graphic objects will come ' from the returned FeatureSet. Dim myGraphicsLayer As New ESRI.ArcGIS.Client.GraphicsLayer ' Ensure the we have a FeatureSet with data. If resultFeatureSet IsNot Nothing AndAlso resultFeatureSet.Features.Count > 0 Then ' Iterate over each feature (which is a Graphic object) in the FeatureSet. For Each graphicFeature As ESRI.ArcGIS.Client.Graphic In resultFeatureSet.Features ' Determine which US State based upon their Attribute "POP2007" value will be assigned a specific ' SimpleFillSymbol. If graphicFeature.Attributes.Item("POP2007") > 15000000 Then graphicFeature.Symbol = TryCast(aSimpleFillSymbol_High, ESRI.ArcGIS.Client.Symbols.Symbol) ElseIf graphicFeature.Attributes.Item("POP2007") > 5000000 Then graphicFeature.Symbol = TryCast(aSimpleFillSymbol_Medium, ESRI.ArcGIS.Client.Symbols.Symbol) Else graphicFeature.Symbol = TryCast(aSimpleFillSymbol_Low, ESRI.ArcGIS.Client.Symbols.Symbol) End If '' Note: there are numerous graphicFeature.Attribute items that can be used for symbolization. '' As an experiment try uncommenting the next few lines of code to see all of the different '' types of attribute information available. 'Dim myStringBuilderDisplayText As New Text.StringBuilder 'Dim allAttributes As System.Collections.Generic.IDictionary(Of String, Object) = graphicFeature.Attributes 'For Each oneKey As String In allAttributes.Keys ' Dim theValue As Object = allAttributes.Item(oneKey) ' myStringBuilderDisplayText.Append(oneKey + ": " + theValue.ToString + vbCrLf) 'Next 'MessageBox.Show(myStringBuilderDisplayText.ToString) ' Add the Graphic to the GraphicsLayer myGraphicsLayer.Graphics.Add(graphicFeature) Next graphicFeature End If ' Add the GraphicsLayer to the Map. It will automatically draw, there is not a need for a refresh. Map1.Layers.Add(myGraphicsLayer) End Sub | |
Requirements
Target Platforms: Windows XP Professional, Windows Server 2003 family, Windows Vista, Windows Server 2008 family, Windows 7, Windows 8