The ArcGIS Schematics extension allows you to quickly produce schematic diagrams from your GIS data or any other data type.
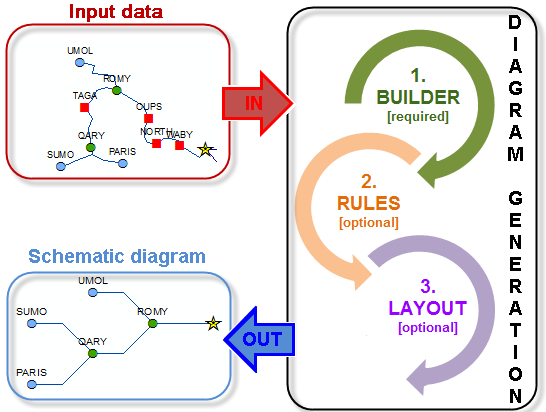
Diagrams generation can be configured as an iterative process where three different schematic components can be executed to create a diagram—schematic builder, schematic rules, and automatic layout.

The schematic builder is the only component required in your configuration; the schematic rules and automatic layout are optional.
When generating a diagram, the schematic builder first goes into action. The builder is the main schematic component in any diagram generation. It expects specific input data or context that it can analyze and decode before transforming this input into schematic features. It works in memory and generally creates a schematic feature for each element it identifies as an input.
Then, if schematic rules are configured for the type of diagrams you are generating, they execute each in turn on the current content of the in-memory diagram—the in-memory diagram content iteratively evolving rule after rule.
Finally, if an automatic layout is specified, it executes on the in-memory diagram.
Diagram sample generations
Configuration sample based on geometric network features
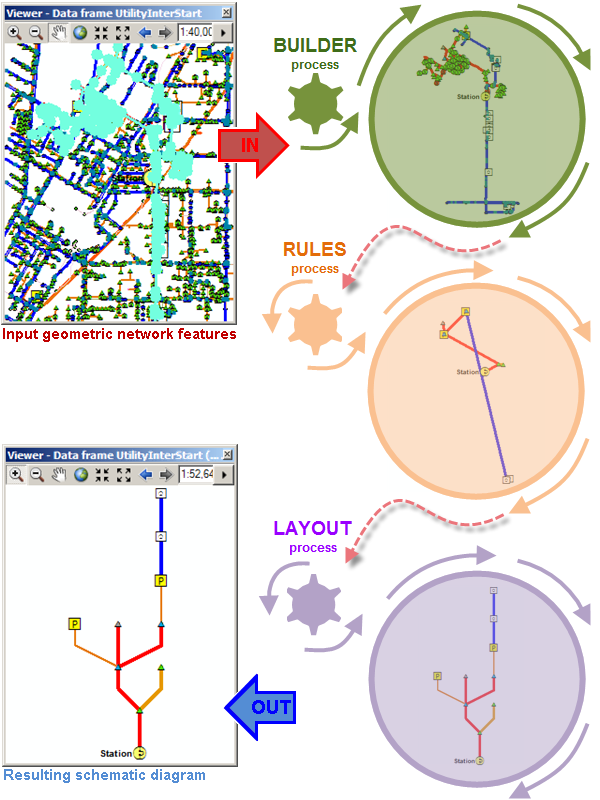
For this first sample scenario, Schematics was used to work on GIS features coming from both a water and an electric geometric networks. Those networks had critical dependencies—for example, the pumping stations on the water network need electricity to be operational. The purpose was to generate very simplified diagrams to easily visualize and understand the network interdependencies and highlight the critical elements on the network.
A diagram template was configured to build schematic diagrams from the two geometric networks. A set of reduction rules was specified to reduce most of the non-critical intervening elements and so only kept the critical infrastructure of the water and electric networks in the diagram. The diagram template was also configured to execute an automatic layout during the generation so the remaining critical elements in the diagram are hierarchically arranged and the distance between them are normalized.
The graphic below shows how a diagram based on this configuration is generated. To generate this sample diagram, Schematics gets a set of 1,032 GIS features as an input. The generation process allows to quickly build a hierarchical simplified diagram that shows only 9 remaining critical network elements (pumping stations, critical transformers, and critical structures), the electric station that feeds them and the way these elements are connected:

Configuration sample based on disconnected GIS features
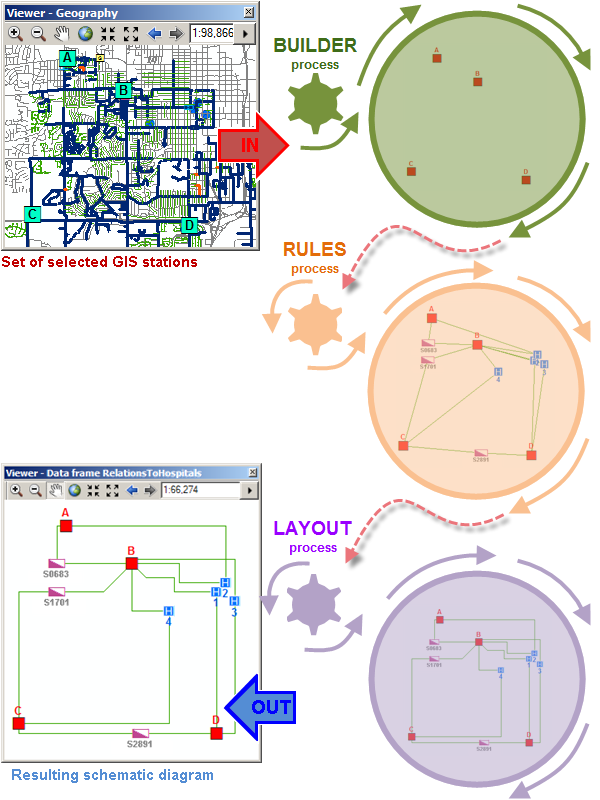
In this second use-case, Schematics was used to generate diagrams from disconnected GIS features. In the database, there was a set of relationship classes that detail relations between some of the GIS features in the database. The idea was to use these relationship classes to generate diagrams that show the relations between GIS features.
For example, a diagram template was configured to build schematic diagrams from electric stations. Thanks to a relationship class that relates electric stations to the switches which provide power to them, and another relationship class relating electric stations to critical infrastructures, relationship rules were specified to create schematic diagrams showing the relations between electric switches and different types of critical infrastructures. The diagram template was also configured to execute an automatic layout during the generation so the schematic features in the created diagram are schematically positioned.
The graphic below shows how a sample diagram based on this configuration is generated. To create this diagram, Schematics starts from a set of 4 stations as an input. The generation process allows to quickly build a rich diagram that shows all the switches that feed the hospitals in the county:

Configuration sample based on network analysis layers
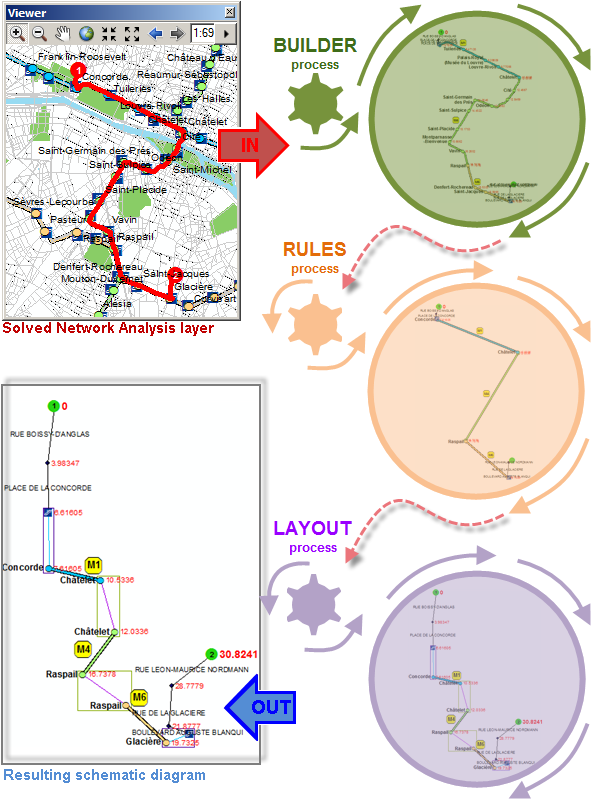
For this third sample scenario, Schematics was used to generate diagrams from solved network analysis layers. The network dataset used here details the streets in Paris, some of the subway main lines, the connections between station entrances/exits (on streets) and station lines (underground), and the connections inside stations that connect to several subway lines. The idea was to use Schematics to create a synthetic schematic road map for pedestrians who want to join a point to another that details each street/interconnection/station/subway line they must go through.
For example, a diagram template was configured to build schematic diagrams from solved route network analysis layer starting from a point location and ending to another location. A set of reduction rules was used to reduce all street junctions along the same street to keep the only start and end point on each street on the route. In the same way, a set of reduction rules was configured to reduce all the stations along the same subway line to keep the only start and end station on each line on the route. Spatial query rules were also configured to add schematic containers which relate the connections in any interconnecting station or relate metro entrance/exit to the underground station. The diagram template was also configured to automatically execute a composite layout during the generation that chains two algorithms—the first algorithm is used to position the schematic features in the diagram at geo-angle directions, and the second algorithm to compress the distance between the network elements.
The graphic below shows how a sample diagram based on this configuration is generated. To create this diagram, Schematics starts from a solved route network analysis layer as an input. The generation process allows to quickly build a rich road map that gives details and directions for each street, metro entrance, metro stations, lines, interconnections that must be taken along the itinerary. Moreover, for each point along the itinerary, a label shows the time spent to reach this point from the starting point:

