Utilize Esri Data
The Business Analyst API gives application developers the ability to flexibly query and analyze Esri's accurate and timely Consumer Spending data.
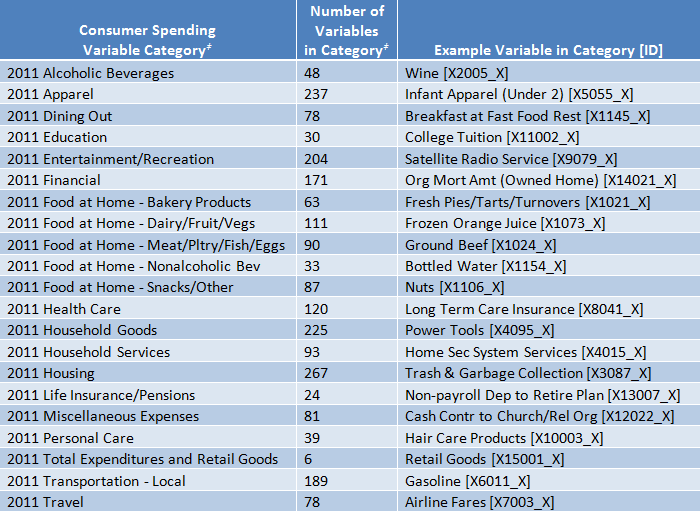
This dataset includes over 2000 variables describing estimates for consumer spending for several categories of goods and services.
These variables give developers the ability to:
- Learn what products and services consumers want
- Compare customer spending data to consumer trends
- Identify profitable customers types by their spending habits
- Tailor promotions to fit consumer demand

Developers can programmatically access the Consumer Spending data through the Business Analyst Online API in a variety of ways
- The Get Summarizations service (REST, SOAP, Flex, Silverlight) gives developers the ability to list all of the Consumer Spending variables available in their Business Analyst API subscription. It also gives developers access to critical metadata such as variable IDs, descriptions, and national average spending values, which can be used to make insightful and actionable comparisons.
- The Benchmark Report service (REST, SOAP, Flex, Silverlight) is a report generation service which gives developers the ability to query a list of analysis variables, including Consumer Spending variables, for study areas which can be described as custom polygons describing user-specified map areas or standard administrative boundary areas such as ZIP codes, counties, Census Tracts, etc. The output of the Benchmark Report service can be PDF for presentation purposes or the API’s simplified XML format (S.XML) for easy integration into systems or applications.
- Like the preceding service, the Smart Map Facts (Thematic Query) service (REST, Flex, Silverlight) also gives developers the option to query a list of analysis variables for study areas described as standard administrative boundary areas but; with a few differences. These differences include the ability to query all standard administrative boundary areas of the same type within an extent or which intersect or overlap with other types of input geographic features such as points, lines, or polygons. An additional difference includes the ability to parse the results from a JSON response.
REST request examples of the three services to query Tapestry Segmentation variables can be found in the supplemental developer notes.
