Географическая информационная система (ГИС) — это система, используемая для описания и характеристики Земли и прочих географических объектов для целей визуализации и анализа пространственно привязанной информации. Данная работа, как правило, выполняется с помощью карт.
Целью ГИС является создание, обмен и применение информационных продуктов на основе карт, которые поддерживают работу организаций, а также создание и управление поддерживаемой географической информацией.
Карты показывают логические наборы географической информации как слои карты. Это очень эффективный способ моделировать и организовывать географическую информацию в виде серии тематических слоев. Кроме того, интерактивные карты ГИС предоставляют основной пользовательский интерфейс для использования географической информации.
How maps are used to apply GIS
A new kind of map is a GIS map, and each GIS map is more than a static map presentation. A GIS map is an interactive window into all geographic information and descriptive data, and into rich spatial analysis models created by GIS professionals.
GIS maps are:
- How you communicate and share GIS
- How GIS content is compiled and maintained
- How geographic information is designed and organized using thematic layers
- How you derive new information using geoprocessing and, subsequently, how you visualize, summarize, analyze, compare, and interpret analytic results
- How you share geographic information for use on the web
In GIS, the map is the interface.
Here are a few examples that illustrate how GIS maps are put to work across organizations.
GIS maps are used for communication and understanding
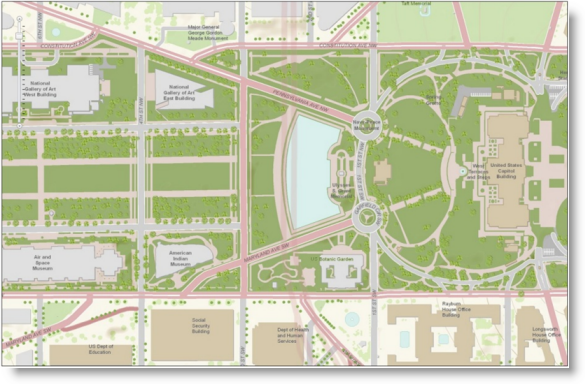
Maps are used to communicate and convey overwhelmingly large amounts of information in an organized way. Humans, as spatial thinkers, are able to view a map, associate map locations with real-world phenomena, and interpret and grasp critical information from the sea of detailed content that is contained within each map display.
GIS maps help you see patterns
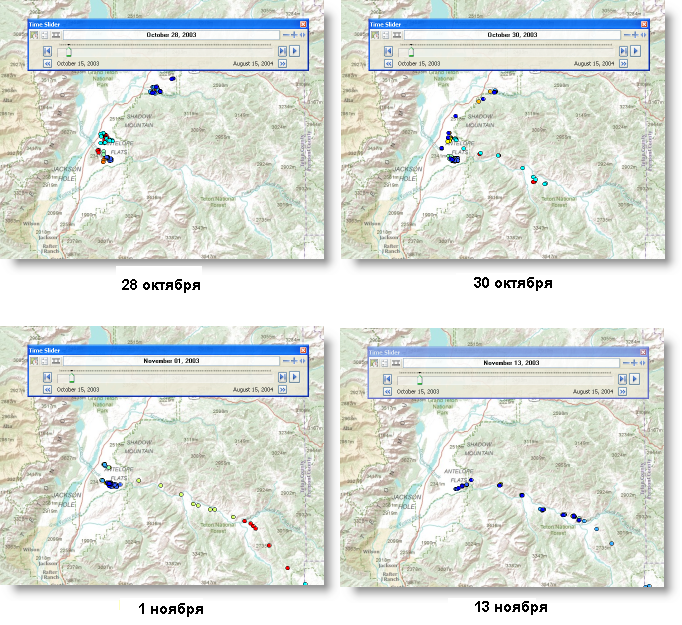
Maps are used to discover and investigate patterns such as the characteristics of a population across a city or the movement of antelope between winter and summer habitats. In GIS, interactive, online maps are used to compare information reports for multiple features and how phenomena change through time.
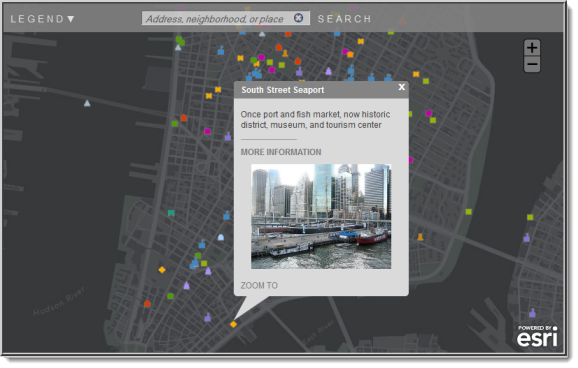
This is a key point. GIS maps provide interactive reports of the information behind the map—not solely lists of attributes but also charts, reports, photos, and virtually any relevant content (for example, a link to a website). Defining how features are reported and what you access through a map feature is one of the key specifications that you design and capture when you create a GIS map.
You can also define and capture map interaction properties for time-aware layers as part of your GIS map definition. For example, here is a map that shows animal movements from GPS tracking devices.
GIS maps are used to derive new information using analysis
You can use a GIS map as a window into rich analytic results. You essentially use your GIS map to access and run analysis models and display their results as a new map layer. Analysis is about working with and evaluating your model results. This is done using the same types of feature reporting, visualization, and animation capabilities described above.
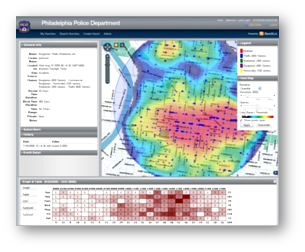
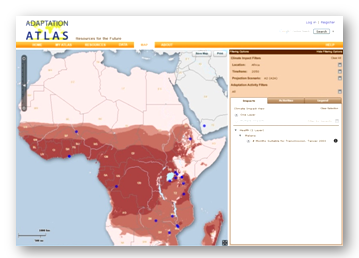
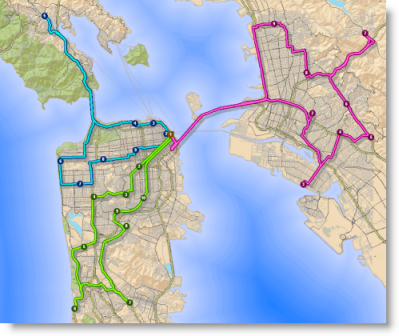
Spatial analysis is one of the more interesting and remarkable aspects of GIS. Using spatial analysis, GIS users can combine information from many independent sources and derive entirely new sets of information (results)—applying a large, rich, and sophisticated set of spatial operators. GIS professionals use geoprocessing to program their own ideas in order to derive these analytical results. In turn, these results are applied to a wide variety of problems.
GIS maps are used to communicate and report status
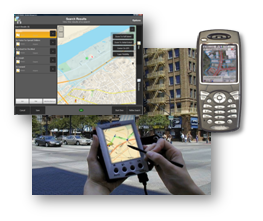
On the web, maps can be used to communicate status and keep teams up-to-date on events. GIS information is dynamic and, for many layers, is updated on a frequent basis. Dynamic maps are an effective way for everyone to see a common picture of the latest information.
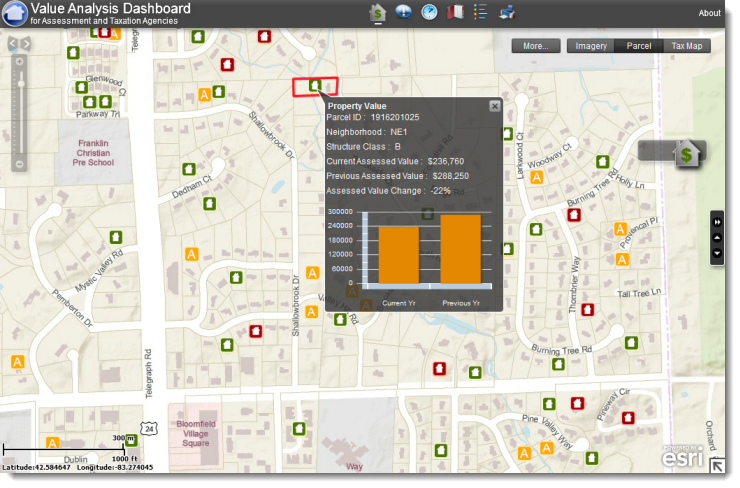
A very common application for GIS is the use of operational dashboards that present data feeds and status for a particular set of activities. The information layers in dashboards are targeted to a specific audience and their operational needs, enabling them to work more effectively and responsively.
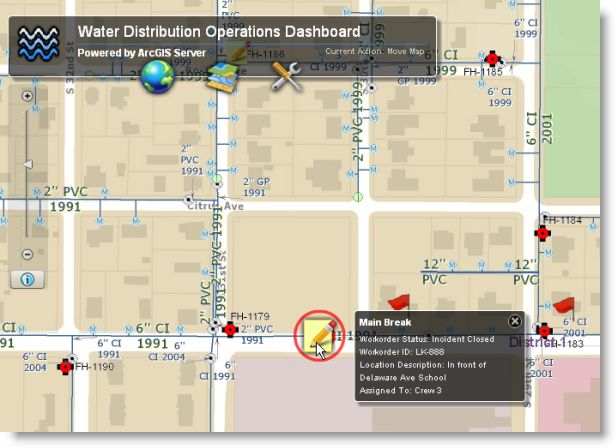
GIS maps are used to compile geographic information
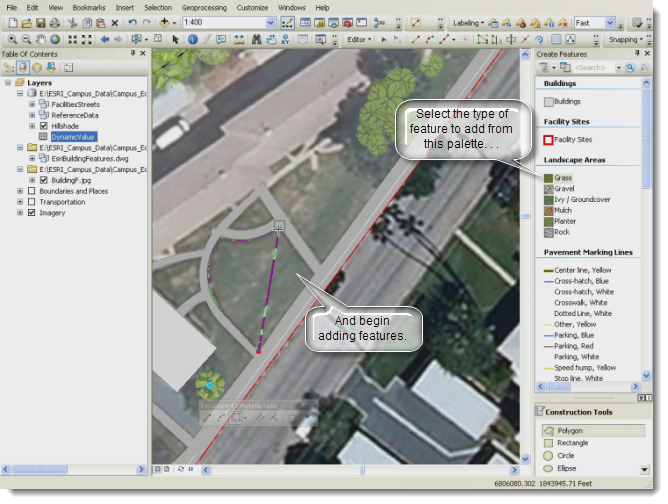
Maps are used to compile and edit features and other data, which are managed and maintained in geodatabases. You essentially use the map as a way to pour your data into the GIS. The best GIS maps for editing present the specific types of features that you want to add to your maps along with the relevant editing tools and attribute properties.
ArcGIS enables users to define and share these editing properties as part of a layer design.
GIS maps are used to communicate ideas, concepts, plans, and designs
Maps help to communicate ideas, plans, and design alternatives. Effective layer display, combined with interactive feature reporting, provide an important mechanism to visualize, communicate, and understand various alternatives.
GIS maps are used to openly share geographic information
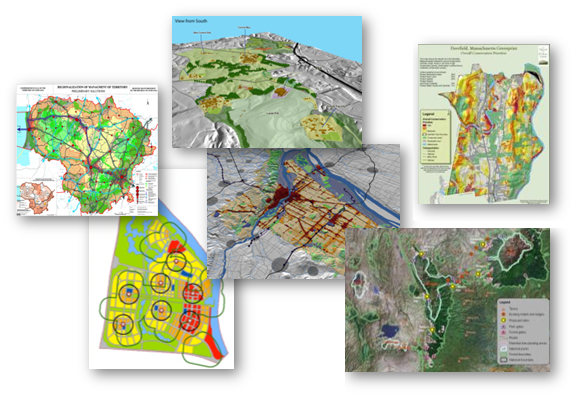
As illustrated by these map examples, maps are both effective and efficient for visualizing geographic knowledge. Great maps help GIS users communicate and share geographic information.
