


 Syntax
| Visual Basic (Declaration) | |
|---|---|
Public Property TimeMode As TimeMode | |
| C# | |
|---|---|
public TimeMode TimeMode {get; set;} | |
Remarks
The TimeExtent that is shown visually in the TimeSlider Control is corresponds to the TimeSlider.Value Property. The TimeMode Property is set to one of three Enumerations:
-
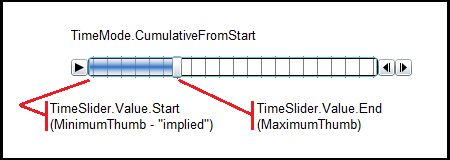
TimeMode.CumulativeFromStart: This TimeMode setting will draw all observations on the Map from the oldest to the current as the MaximumThumb crosses a tick mark. It draws observations in a 'cumulative' effect. As the animation occurs, the TimeSlider.Value.Start will remain static but the TimeSlider.Value.End will constantly change. The MinimumThumb is not shown and is implied to be the same as the TimeSlider.Value.Start. The color in the Foreground of the TimeSlider will shade from the TimeSlider.Value.Start through the TimeSlider.Value.End as animation occurs. This is the default TimeMode setting on the TimeSlider. See the following screen shot:
-
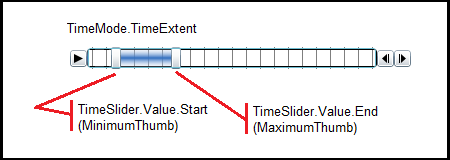
TimeMode.TimeExtent: This TimeMode setting will draw only those observations on the Map that fall in a 'window of time' as defined by the TimeSlider.Value. As the thumbs (MinimumThumb and MaximumThumb) of the 'window of time' move across the tick marks the older observations will disappear and newer ones will appear. As the animation occurs, the TimeSlider.Value.Start (analogous to the MinimumThumb) will constantly change and the TimeSlider.Value.End (analogous to the MaximumThumb) will constantly change but the two difference between the Start and End times will be fixed. The Foreground shading of the TimeSlider will display in between the two thumbs as the animation occurs. See the following screen shot:
-
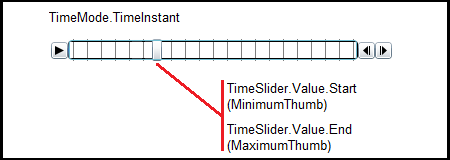
TimeMode.TimeInstant: This TimeMode setting will draw only the most recent observations on the Map as the thumb(s) (MinimumThumb and MaximumThumb) crosses a tick mark. It draws observations in a 'snapshot' effect. As the animation occurs, the TimeSlider.Value.Start and the TimeSlider.Value.End will be exactly the same but values will change continuously. The MinimumThumb and MaximumThumb overlap each other exactly and give the visual appearance of only one thumb being show to demonstrate the snapshot effect. No Foreground shading occurs in the TimeSlider in the TimeMode.TimeInstant setting. See the following screen shot:
Example
How to use:
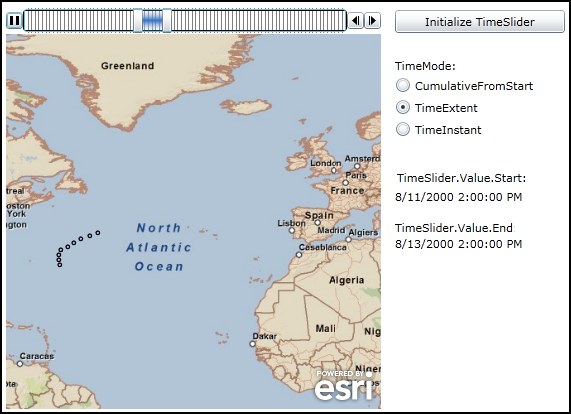
Click the 'Initialize TimeSlider' button to set up the TimeSlider's functionality. Then click the play button on the TimeSlider to view the animation. Click the different TimeMode RadioButtons to see the visual effect on the Map and the TimeSlider.Value Property (aka. TimeExtent).
The XAML code in this example is used in conjunction with the code-behind (C# or VB.NET) to demonstrate the functionality.
The following screen shot corresponds to the code example in this page.
| XAML |  Copy Code Copy Code |
|---|---|
<Grid x:Name="LayoutRoot" Background="White"> <!-- Provide the instructions on how to use the sample code. --> <TextBlock Height="63" HorizontalAlignment="Left" Name="TextBlock1" VerticalAlignment="Top" Width="537" TextWrapping="Wrap" Margin="12,0,0,0" Text="Click the 'Initialize TimeSlider' button to set up the TimeSlider's functionality. Then click the play button on the TimeSlider to view the animation. Click the different TimeMode RadioButtons to see the visual effect on the Map and the TimeSlider.Value Property (aka. TimeExtent)." /> <!-- Add a Map Control with an ArcGISTiledMapServiceLayer and a FeatureLayer. The ArcGISTiledMapsServiceLayer is the first Layer in Map.LayerCollection and is drawn on the bottom. The FeatureLayer is then added and draws on top. Set the Map.Extent to zoom to the middle of the Atlantic Ocean. Setting the Map.TimeExtent acts like a Where clause in that only those features/records that fall within the set TimeSlider.Value (which is a narrowed TimeExtent) will then be shown. By Binding the Map.TimeExtent to the TimeSlider.Value Property, the Map will automatically update as the thumb on the TimeSlider moves. --> <esri:Map Name="Map1" Background="White" Height="375" Width="375" Margin="12,93,0,0" VerticalAlignment="Top" HorizontalAlignment="Left" Extent="-69.78,0.52,10.01,80.33" TimeExtent="{Binding ElementName=TimeSlider1, Path=Value}"> <!-- Add an ArcGISTiledMapsServiceLayer. --> <esri:ArcGISTiledMapServiceLayer ID="StreetMapLayer" Url="http://services.arcgisonline.com/ArcGIS/rest/services/ESRI_StreetMap_World_2D/MapServer"/> <!-- The FeatureLayer contains Hurricane data from NOAA as Markers (aka. Points). The Where clause is optional. It is necessary when more that 500/1000 records returned. In ArcGIS Server 9.3.1 and prior, the default maximum is 500 records returned per FeatureLayer. In ArcGIS Server 10 the default is 1000. This setting is configurable per map service using ArcCatalog or ArcGIS Server Manager (on the Parameters tab). The Where clause gets only hurricane data for Alberto (a much smaller subset of the entire service). Specify the Outfields Property to specify which Fields are returned. Specifying the wildcard (*) character will return all Fields. --> <esri:FeatureLayer ID="MyFeatureLayer" Where="EVENTID = 'Alberto'" OutFields="*" Url="http://servicesbeta.esri.com/ArcGIS/rest/services/Hurricanes/Hurricanes/MapServer/0"/> </esri:Map> <!-- Add a TimeSlider. The initialization of the TimeSlider will be handled in the code-behind when the user clicks the Button_InitializeTimeSlider. The initialization of the TimeSlider will handle setting the Properties of .MinimumValue, .MaximumValue, .Intervals, .PlaySpeed, .Loop, and .TimeMode. --> <esri:TimeSlider Name="TimeSlider1" HorizontalAlignment="Left" VerticalAlignment="Top" Height="25" Width="375" Margin="12,67,0,0"/> <!-- Add a Button to initialize the TimeSlider. The Click Event has associated code-behind. --> <Button Name="Button_InitializeTimeSlider" Content="Initialize TimeSlider" Height="23" Width="170" HorizontalAlignment="Left" VerticalAlignment="Top" Margin="401,69,0,0" Click="Button_InitializeTimeSlider_Click" /> <!-- Add three RadioButtons to control the TimeMode Property on the TimeSlider. Each RadioButton has a Click event with associated code-behind. --> <sdk:Label Name="Label_TimeMode" Content="TimeMode:" Height="28" Width="120" Margin="401,117,0,0" VerticalAlignment="Top" HorizontalAlignment="Left" /> <RadioButton Name="RadioButton_CumulativeFromStart" Content="CumulativeFromStart" Height="16" HorizontalAlignment="Left" VerticalAlignment="Top" Margin="401,136,0,0" Click="RadioButton_CumulativeFromStart_Click"/> <RadioButton Name="RadioButton_TimeExtent" Content="TimeExtent" Height="16" HorizontalAlignment="Left" VerticalAlignment="Top" Margin="401,158,0,0" Click="RadioButton_TimeExtent_Click"/> <RadioButton Name="RadioButton_TimeInstant" Content="TimeInstant" Height="16" HorizontalAlignment="Left" VerticalAlignment="Top" Margin="401,180,0,0" Click="RadioButton_TimeInstant_Click"/> <!-- Add a TextBlock to display the TimeSlider.Value.Start. The TextBlock.Content Property uses Binding to automatically update any changes from the TimeSlider.Value.Start as the thumb of the TimeSlider moves. Depending on the TimeSlider.TimeMode setting you will notice different behavior of what gets displayed in the TextBlock. --> <sdk:Label Name="Label_TimeSliderValueStart" Content="TimeSlider.Value.Start:" Margin="403,229,0,0" Height="28" Width="131" HorizontalAlignment="Left" VerticalAlignment="Top" /> <TextBlock Name="TextBlock_StartTime" Text="{Binding ElementName=TimeSlider1, Path=Value.Start}" HorizontalAlignment="Left" VerticalAlignment="Top" Width="175" Height="23" Margin="401,248,0,0" /> <!-- Add a TextBlock to display the TimeSlider.Value.End. The TextBlock.Content Property uses Binding to automatically update any changes from the TimeSlider.Value.End as the thumb of the TimeSlider moves. Depending on the TimeSlider.TimeMode setting you will notice different behavior of what gets displayed in the TextBlock. --> <sdk:Label Name="Label_TimeSliderValueEnd" Content="TimeSlider.Value.End:" Margin="401,279,0,0" Height="29" Width="120" HorizontalAlignment="Left" VerticalAlignment="Top" /> <TextBlock Name="TextBlock_EndTime" Text="{Binding ElementName=TimeSlider1, Path=Value.End}" HorizontalAlignment="Left" VerticalAlignment="Top" Width="175" Height="23" Margin="401,295,0,0" /> </Grid> | |
| C# | Copy Code |
|---|---|
private void Button_InitializeTimeSlider_Click(object sender, System.Windows.RoutedEventArgs e) { // This function sets up the various initialization Properties for the TimeSlider (.MinimumValue, // .MaximumValue, .Intervals, .PlaySpeed, .Loop and .TimeMode). // NOTE: // The bare minimum Properties that need to be set on the TimeSlider in order to have functioning // interaction between the TimeSlider and Map Control's are .MimimumValue, .MaximumValue, and // .Value (as well as binding the Map.TimeExtent to the TimeSlider.Value). This will give a // TimeSlider where the user can move the thumb(s) and have the Map Control respond accordingly. // But having only this bare minimum will not provide the full functionality of the PlayPauseButton, // NextButton, and PreviousButton being visible. In order to have the full functionality of the // TimeSlider the .Intervals Property must also be set. // Obtain the FeatureLayer that has the temporal data in the Map Control. ESRI.ArcGIS.Client.FeatureLayer theFeatureLayer = Map1.Layers["MyFeatureLayer"]; // Using the custom GetTimeExtentFromGraphicCollection function, obtain the a TimeExtent (i.e. a span of time) // from the GraphicCollection of the FeatureLayer. The FeatureLayer.TimeExtent Property could have been used // but that would have returned the entire TimeExtent of the FeatureLayer map service. Since our FeatureLayer // was defined in XAML to have a Where clause to restrict the data returned to be only those temporal events // associated with hurricane Alberto, we only want the TimeExtent associated with hurricane Alberto. The // GetTimeExtentFromGraphicCollection function obtains the TimeExtent for just the features in the // GraphicCollection associated with hurricane Alberto and not the entire FeatureLayer.TimeExtent. ESRI.ArcGIS.Client.GraphicCollection theGraphicCollection = theFeatureLayer.Graphics; ESRI.ArcGIS.Client.TimeExtent theTimeExtent = GetTimeExtentFromGraphicCollection(theGraphicCollection); // Set the TimeSlider's .MinimumValue and .MaximumValue Properties from Alberto's TimeExtent. DateTime theStartDate = theTimeExtent.Start; DateTime theEndDate = theTimeExtent.End; TimeSlider1.MinimumValue = theStartDate; TimeSlider1.MaximumValue = theEndDate; // Create a new TimeSpan (6 hours in our case). TimeSpan theTimeSpan = new TimeSpan(0, 6, 0, 0); // Create an empty Collection of IEnumerable<DateTime> objects. System.Collections.Generic.IEnumerable<Date> theIEnumerableDates = null; // Load all of DateTimes into the IEnumerable<DateTime> object using the Shared/Static function // TimeSlider.CreateTimeStopsByTimeInterval. theIEnumerableDates = ESRI.ArcGIS.Client.Toolkit.TimeSlider.CreateTimeStopsByTimeInterval(theTimeExtent, theTimeSpan); // Set the TimeSlider.Intervals to define the tick marks along the TimeSlider track from the IEnumerable<DateTime> // object. Each tick mark will be 6 hours apart starting from theTimeExtent.Start and ending with theTimeExtent.End. TimeSlider1.Intervals = theIEnumerableDates; // Initialize the thumb's initial start position of the TimeSlider to be the leftmost. The individual DateTime objects // within the IEnumerable<DateTime> are ordered in the from oldest (.First) to newest (.Last). You could have also // used theTimeExtent.Start. TimeSlider1.Value = new ESRI.ArcGIS.Client.TimeExtent(theIEnumerableDates.First); // Set the TimeSlider.TimeMode to CumulativeFromStart and set the RadioButton_CumulativeFromStart as being // checked. Users can interactively change the TimeMode and see the different effects once the TimeSlider is // initialized. TimeSlider1.TimeMode = ESRI.ArcGIS.Client.Toolkit.TimeMode.CumulativeFromStart; RadioButton_CumulativeFromStart.IsChecked = true; // The default TimeSlider.Play Speed is 1 second but we want a faster redraw of the Graphics, so we are setting // it to 1/2 of a second. The following 4 constructors all produce the same results: TimeSlider1.PlaySpeed = new TimeSpan(500000); // ticks //TimeSlider1.PlaySpeed = New TimeSpan(0, 0, 0.5); // hours, minutes, seconds //TimeSlider1.PlaySpeed = New TimeSpan(0, 0, 0, 0.5); // days, hours, minutes, seconds //TimeSlider1.PlaySpeed = New TimeSpan(0, 0, 0, 0, 50); // days, hours, minutes, seconds, milliseconds // Enable continuous playback of the TimeSlider. TimeSlider1.Loop = true; } public ESRI.ArcGIS.Client.TimeExtent GetTimeExtentFromGraphicCollection(ESRI.ArcGIS.Client.GraphicCollection myGraphicCollection) { // This function obtains the a TimeExtent (i.e. a span of time) from a GraphicCollection. An assumption is made // specific to the FeatureLayer in this example that an Attribute called 'Date_Time' is present (which is the // Date of the temporal observation of the hurricane). It is also assumed that ALL of the temporal observations // have valid DateTime information. If there are any temporal observations that have Nothing/null values, the logic // of this function will need modification. // Define new variables to hold the start and end Dates of all the temporal observations in the GraphicCollection. DateTime startDate = new DateTime(); DateTime endDate = new DateTime(); // Loop through each Graphic in the GraphicCollection. foreach (ESRI.ArcGIS.Client.Graphic theGraphic in myGraphicCollection) { // Obtain the DateTime of the temporal observation from the Graphic.Attribute. If you use your own map service // dataset, you will need to change the Attribute field name accordingly. DateTime aDate = theGraphic.Attributes["Date_Time"]; // Seed the initial startDate with the first observation in the GraphicCollection. if (startDate == new DateTime()) { startDate = aDate; } // Seed the initial endDate with the first observation in the GraphicCollection. if (endDate == new DateTime()) { endDate = aDate; } // If the aDate is earlier than startDate then set it to the startDate. if (aDate < startDate) { startDate = aDate; } // If the aDate is later than endDate then set it to the endDate. if (aDate > endDate) { endDate = aDate; } } // Construct the TimeExtent from the startDate and endDate. ESRI.ArcGIS.Client.TimeExtent theTimeExtent = new ESRI.ArcGIS.Client.TimeExtent(startDate, endDate); // Return the TimeExtent to the caller. return theTimeExtent; } private void RadioButton_CumulativeFromStart_Click(object sender, System.Windows.RoutedEventArgs e) { // This TimeMode setting will draw all points on the Map from the oldest observation to the current // observation as the thumb crosses a tick mark. It draws observations in a 'cumulative' effect. As // the animation occurs, the TimeSlider.Value.Start will remain static but the TimeSlider.Value.End // will constantly change. // Set the TimeSlider.TimeMode to the TimeMode.CumulativeFromStart enumeration. TimeSlider1.TimeMode = ESRI.ArcGIS.Client.Toolkit.TimeMode.CumulativeFromStart; // Move the thumb of the TimeSlider to the leftmost position. TimeSlider1.Value = new ESRI.ArcGIS.Client.TimeExtent(TimeSlider1.Intervals.First); } private void RadioButton_TimeExtent_Click(object sender, System.Windows.RoutedEventArgs e) { // This TimeMode setting will draw only those points on the Map that fall in a 'window of time' as defined // by the TimeSlider.Value. As the thumb of the 'window of time' moves across the tick marks the older // observations will disappear and newer ones will appear. As the animation occurs, the TimeSlider.Value.Start // will constantly change and the TimeSlider.Value.End will constantly change but the two difference between // the Start and End times will be fixed. // Set the TimeSlider.TimeMode to the TimeMode.Time enumeration. TimeSlider1.TimeMode = ESRI.ArcGIS.Client.Toolkit.TimeMode.TimeExtent; // Get the IEnumerable<DateTime> from the TimeSlider.Intervals Property. IEnumerable<DateTime> myIntervals = TimeSlider1.Intervals; // Obtain the first DateTime observation in the IEnumerable<DateTime>, which is the oldest DateTime. DateTime theStartDate = myIntervals.First(); // Set the thumb of the TimeSlider to be a 'window of time' that covers a 2 day (48 hours) period. The // thumb that represents a 'window of time' will be moved to the leftmost position. TimeSlider1.Value = new ESRI.ArcGIS.Client.TimeExtent(theStartDate, theStartDate.AddHours(48)); } private void RadioButton_TimeInstant_Click(object sender, System.Windows.RoutedEventArgs e) { // This TimeMode setting will draw only the most recent observations on the Map as the thumb crosses // a tick mark. It draws observations in a 'snapshot' effect. As the animation occurs, the // TimeSlider.Value.Start and the TimeSlider.Value.End will be exactly the same but values will change // continuously. // Set the TimeSlider.TimeMode to the TimeMode.TimeInstant enumeration. TimeSlider1.TimeMode = ESRI.ArcGIS.Client.Toolkit.TimeMode.TimeInstant; // Move the thumb of the TimeSlider to the leftmost position. TimeSlider1.Value = new ESRI.ArcGIS.Client.TimeExtent(TimeSlider1.Intervals.First); } | |
| VB.NET | Copy Code |
|---|---|
Private Sub Button_InitializeTimeSlider_Click(ByVal sender As System.Object, ByVal e As System.Windows.RoutedEventArgs) ' This function sets up the various initialization Properties for the TimeSlider (.MinimumValue, ' .MaximumValue, .Intervals, .PlaySpeed, .Loop and .TimeMode). ' NOTE: ' The bare minimum Properties that need to be set on the TimeSlider in order to have functioning ' interaction between the TimeSlider and Map Control's are .MimimumValue, .MaximumValue, and ' .Value (as well as binding the Map.TimeExtent to the TimeSlider.Value). This will give a ' TimeSlider where the user can move the thumb(s) and have the Map Control respond accordingly. ' But having only this bare minimum will not provide the full functionality of the PlayPauseButton, ' NextButton, and PreviousButton being visible. In order to have the full functionality of the ' TimeSlider the .Intervals Property must also be set. ' Obtain the FeatureLayer that has the temporal data in the Map Control. Dim theFeatureLayer As ESRI.ArcGIS.Client.FeatureLayer = Map1.Layers.Item("MyFeatureLayer") ' Using the custom GetTimeExtentFromGraphicCollection function, obtain the a TimeExtent (i.e. a span of time) ' from the GraphicCollection of the FeatureLayer. The FeatureLayer.TimeExtent Property could have been used ' but that would have returned the entire TimeExtent of the FeatureLayer map service. Since our FeatureLayer ' was defined in XAML to have a Where clause to restrict the data returned to be only those temporal events ' associated with hurricane Alberto, we only want the TimeExtent associated with hurricane Alberto. The ' GetTimeExtentFromGraphicCollection function obtains the TimeExtent for just the features in the ' GraphicCollection associated with hurricane Alberto and not the entire FeatureLayer.TimeExtent. Dim theGraphicCollection As ESRI.ArcGIS.Client.GraphicCollection = theFeatureLayer.Graphics Dim theTimeExtent As ESRI.ArcGIS.Client.TimeExtent = GetTimeExtentFromGraphicCollection(theGraphicCollection) ' Set the TimeSlider's .MinimumValue and .MaximumValue Properties from Alberto's TimeExtent. Dim theStartDate As Date = theTimeExtent.Start Dim theEndDate As Date = theTimeExtent.End TimeSlider1.MinimumValue = theStartDate TimeSlider1.MaximumValue = theEndDate ' Create a new TimeSpan (6 hours in our case). Dim theTimeSpan As New TimeSpan(0, 6, 0, 0) ' Create an empty Collection of IEnumerable(Of Date) objects. Dim theIEnumerableDates As System.Collections.Generic.IEnumerable(Of Date) ' Load all of Dates into the IEnumerable(Of Date) object using the Shared/Static function ' TimeSlider.CreateTimeStopsByTimeInterval. theIEnumerableDates = ESRI.ArcGIS.Client.Toolkit.TimeSlider.CreateTimeStopsByTimeInterval(theTimeExtent, theTimeSpan) ' Set the TimeSlider.Intervals to define the tick marks along the TimeSlider track from the IEnumerable(Of Date) ' object. Each tick mark will be 6 hours apart starting from theTimeExtent.Start and ending with theTimeExtent.End. TimeSlider1.Intervals = theIEnumerableDates ' Initialize the thumb's initial start position of the TimeSlider to be the leftmost. The individual Date objects ' within the IEnumerable(Of Date) are ordered in the from oldest (.First) to newest (.Last). You could have also ' used theTimeExtent.Start. TimeSlider1.Value = New ESRI.ArcGIS.Client.TimeExtent(theIEnumerableDates.First) ' Set the TimeSlider.TimeMode to CumulativeFromStart and set the RadioButton_CumulativeFromStart as being ' checked. Users can interactively change the TimeMode and see the different effects once the TimeSlider is ' initialized. TimeSlider1.TimeMode = ESRI.ArcGIS.Client.Toolkit.TimeMode.CumulativeFromStart RadioButton_CumulativeFromStart.IsChecked = True ' The default TimeSlider.Play Speed is 1 second but we want a faster redraw of the Graphics, so we are setting ' it to 1/2 of a second. The following 4 constructors all produce the same results: TimeSlider1.PlaySpeed = New TimeSpan(500000) ' ticks 'TimeSlider1.PlaySpeed = New TimeSpan(0, 0, 0.5) ' hours, minutes, seconds 'TimeSlider1.PlaySpeed = New TimeSpan(0, 0, 0, 0.5) ' days, hours, minutes, seconds 'TimeSlider1.PlaySpeed = New TimeSpan(0, 0, 0, 0, 50) ' days, hours, minutes, seconds, milliseconds ' Enable continuous playback of the TimeSlider. TimeSlider1.Loop = True End Sub Public Function GetTimeExtentFromGraphicCollection(ByVal myGraphicCollection As ESRI.ArcGIS.Client.GraphicCollection) As ESRI.ArcGIS.Client.TimeExtent ' This function obtains the a TimeExtent (i.e. a span of time) from a GraphicCollection. An assumption is made ' specific to the FeatureLayer in this example that an Attribute called 'Date_Time' is present (which is the ' Date of the temporal observation of the hurricane). It is also assumed that ALL of the temporal observations ' have valid Date information. If there are any temporal observations that have Nothing/null values, the logic ' of this function will need modification. ' Define new variables to hold the start and end Dates of all the temporal observations in the GraphicCollection. Dim startDate As New Date Dim endDate As New Date ' Loop through each Graphic in the GraphicCollection. For Each theGraphic As ESRI.ArcGIS.Client.Graphic In myGraphicCollection ' Obtain the Date of the temporal observation from the Graphic.Attribute. If you use your own map service ' dataset, you will need to change the Attribute field name accordingly. Dim aDate As Date = theGraphic.Attributes.Item("Date_Time") ' Seed the initial startDate with the first observation in the GraphicCollection. If startDate = Nothing Then startDate = aDate End If ' Seed the initial endDate with the first observation in the GraphicCollection. If endDate = Nothing Then endDate = aDate End If ' If the aDate is earlier than startDate then set it to the startDate. If aDate < startDate Then startDate = aDate End If ' If the aDate is later than endDate then set it to the endDate. If aDate > endDate Then endDate = aDate End If Next ' Construct the TimeExtent from the startDate and endDate. Dim theTimeExtent As New ESRI.ArcGIS.Client.TimeExtent(startDate, endDate) ' Return the TimeExtent to the caller. Return theTimeExtent End Function Private Sub RadioButton_CumulativeFromStart_Click(ByVal sender As System.Object, ByVal e As System.Windows.RoutedEventArgs) ' This TimeMode setting will draw all points on the Map from the oldest observation to the current ' observation as the thumb crosses a tick mark. It draws observations in a 'cumulative' effect. As ' the animation occurs, the TimeSlider.Value.Start will remain static but the TimeSlider.Value.End ' will constantly change. ' Set the TimeSlider.TimeMode to the TimeMode.CumulativeFromStart enumeration. TimeSlider1.TimeMode = ESRI.ArcGIS.Client.Toolkit.TimeMode.CumulativeFromStart ' Move the thumb of the TimeSlider to the leftmost position. TimeSlider1.Value = New ESRI.ArcGIS.Client.TimeExtent(TimeSlider1.Intervals.First) End Sub Private Sub RadioButton_TimeExtent_Click(ByVal sender As System.Object, ByVal e As System.Windows.RoutedEventArgs) ' This TimeMode setting will draw only those points on the Map that fall in a 'window of time' as defined ' by the TimeSlider.Value. As the thumb of the 'window of time' moves across the tic marks the older ' observations will disappear and newer ones will appear. As the animation occurs, the TimeSlider.Value.Start ' will constantly change and the TimeSlider.Value.End will constantly change but the two difference between ' the Start and End times will be fixed. ' Set the TimeSlider.TimeMode to the TimeMode.Time enumeration. TimeSlider1.TimeMode = ESRI.ArcGIS.Client.Toolkit.TimeMode.TimeExtent ' Get the IEnumerable(Of Date) from the TimeSlider.Intervals Property. Dim myIntervals As IEnumerable(Of Date) = TimeSlider1.Intervals ' Obtain the first Date observation in the IEnumerable(Of Date), which is the oldest Date. Dim theStartDate As Date = myIntervals.First() ' Set the thumb of the TimeSlider to be a 'window of time' that covers a 2 day (48 hours) period. The ' thumb that represents a 'window of time' will be moved to the leftmost position. TimeSlider1.Value = New ESRI.ArcGIS.Client.TimeExtent(theStartDate, theStartDate.AddHours(48)) End Sub Private Sub RadioButton_TimeInstant_Click(ByVal sender As System.Object, ByVal e As System.Windows.RoutedEventArgs) ' This TimeMode setting will draw only the most recent observations on the Map as the thumb crosses ' a tick mark. It draws observations in a 'snapshot' effect. As the animation occurs, the ' TimeSlider.Value.Start and the TimeSlider.Value.End will be exactly the same but values will change ' continuously. ' Set the TimeSlider.TimeMode to the TimeMode.TimeInstant enumeration. TimeSlider1.TimeMode = ESRI.ArcGIS.Client.Toolkit.TimeMode.TimeInstant ' Move the thumb of the TimeSlider to the leftmost position. TimeSlider1.Value = New ESRI.ArcGIS.Client.TimeExtent(TimeSlider1.Intervals.First) End Sub | |
Requirements
Target Platforms: Windows XP Professional, Windows Server 2003 family, Windows Vista, Windows Server 2008 family, Windows 7, Windows 8